Showing posts with label ZMH. Show all posts

Tuesday, May 15, 2007

Peeking my head out with some trade reviews

Ladies and Gentlemen,
Please excuse my long silence on the blog. Life seems to get in the way of trading and blogging sometimes and one just has to decide what noise to filter out from time to time. These posts take a long time, so the blogging has had to take a back seat for a while. I'll be busy with performances in the next two months, so it'll be sporadic, but I'll try to get some action going here again. I will make an effort to do shorter, simpler posts. (I know I've said that before!) But this won't be one of them. It is a review of some of the trades I've discussed or proposed on the blog. Most of it is actually a post I put together well over a month ago but never published.

First, just a follow up on the WFR trade I set up in this post, the contingent sell order I had set to sell at or below 58.83 triggered on April 13 and the options sold for 13.60, a total loss in the trade of $720. This is within the acceptable risk allotment, as discussed in that post. It is a bummer to get stopped out on an inter-day swing, particularly when it moves up $7 starting the next day. Of course, whether or not I would have taken profits at $67 as mentioned before it gapped down at earnings is a whole other story. I will point out, though, that had I held over earnings and been on board for that big gap down, the selling price on April 27 would have been right around $13(I looked at a chart of the option), still keeping me within the acceptable loss parameter of $1000.


And now for the "Draft" that I never published:

It's been a long time coming, so I'm finally reviewing some trades I did from our list.

Back in early February, I mentioned a potential trade on CRDN going into earnings. Looking back at it, it wasn't exactly a screaming entry signal. But with a plan to capitalize on growing IV going into earnings and SELLING BEFORE EARNINGS, it was a reasonable play. I did wait a few days for the entry from the day I posted the idea. I chose the OTM calls because with rising IV, the 60 calls would be likely to have very worthwhile gains if the stock did move up to the 60 level. This was a paper trade.

Not including commissions, the trade resulted in a profit of 36%. Note that I sold at the weakest point of the three days surrounding the sell day.


On January 29, I put up a very extensive post on COH. After rambling through various ideas, I considered the prospect of a March 40/45 vertical spread. This was a very conservative trade idea giving the stock plenty of time to move past the 45 level for the max profit potential. Of course, looking at the run the stock had immediately after the post, I would rather have been in straight calls, but so it goes. A profit is a profit. Because of the quick run up, I put in place a GTC limit order to close the trade for almost the full profit potential well ahead of March expiration. Had I placed the original trade on January 30th rather than the 31st, I would have had a slightly better credit. Regardless, not including commissions, the trade shows a 34% return.
This was a paper trade.


Finally, a trade with a great entry and foolish but lucky exit. This was with real money. I did a post on list performers and mentioned a potential entry for ZMH. The next day the stock closed higher for a beautiful "high of the the low day" entrance. After gapping up on big volume, the stock pulled back a few days and on the first resumption of upward movement, there was the entry. I moved up my stop loss order on the evening of the 25th and mistakenly placed a limit order instead of a stop order. So it sold the next day immediately. I turned a quick 20% profit and was very lucky that I was out before the next day's market sell off. I've made public admissions of entirely moronic losses I've taken, so why not admit to a moronic profit? Actually, though, the entry was quite good, just a silly exit. Regardless, this still shows the value of a great entry. Even with the market's ups and downs since then, a holder of this stock or deep ITM options as I suggested would still be comfortable holding a position here at a small profit.


Okay then. That's all for now. Be careful out there. Markets look a bit long in the tooth.

Tuesday, March 20, 2007

Updating/weeding out the list

Today the market had very respectable and possibly encouraging gains. But judging from the volume on the major index ETFs, trading was not heavy enough to look at the day's action as a convincing change of sentiment in the market. This images shows a daily chart of the three majors since November with a 30 day Moving average. All of them have areas of likely resistance to overcome before any serious bullish posture could be entertained again. In addition to resistance levels from price action, the descending 30 MAs might just might provide another influential nudge to the down side.
It should be noted that they all are in a double bottom reversal pattern, but there are a few things to consider. 1) The pattern is meaningless until the resistance from the high between the two bottoms is broken. 2) A bullish reversal should come at the bottom of a bearish trend. The recent bearishness is really just the first breakdown of a very bullish trend and not yet a trend with lower highs and lower lows(I'm looking at SPY on a daily closing basis). So, looking for an upward "reversal" seems a bit premature.
(Click for a larger view.)


While the market is sorting itself out, this is an ideal time to rebalance our lists. Everyone should be working on a bearish watchlist. Despite the current state of things, I think we should always focus on the primary watchlist for the group as a bullish watchlist. After all, that direction is the ultra long term bias and nature of the market. Besides, many people may not be interested in or comfortable with shorting the market or trading bearish. When the market does resume its strength, we want to be ready with a list of well chosen stocks that are likely to be among the first and strong participants of a new rally. But first we've got to get rid of the current stocks that are less attractive at this point.
I mentioned a few thoughts about trimming down our list a few posts ago. Here's a complete run down on what I think should go and what should stay.
First: here's a look at the list and how it scores in the Investools Phase 1 and Phase 2 analyzer.


The simplest way to start is by getting rid of KBH, UNT and ZMH because they have a combined F/E score of less than 3.25. I'm a bit sad to see ZMH go, particularly as it continues to work on a new 52 week high. But the growth estimates is less than our ideal 20% and it is estimated to grow at a pace slower than its group this year and also in the next 5 years.

Also, because the Estimates score is forward looking, we'd prefer for that score to be the stronger of the two, if possible. For that reason, I'd also like to see CRDN, WCC, and BHI leave our list.
CRDN - Growth estimates are a low 7.5%. Also estimated to under perform its group this year and next. Set an alert on this one for when it breaks 62.50 and forget it.
WCC - Growth estimate is less than 20% and it is estimated to under perform its group this year and next. It's been in a range between 55 and 70 for about 9 months. Set an alert to notify you if it goes above 70 and forget it.
BHI - It is actually very attractive from a valuation standpoint. PEG is .45 with a P/E well under its group. But the most recent earnings miss and the current and next year's estimates for earnings growth well below the group look like red flags. The chart is a mess with the gap down on the recent earnings announcement. It has also not participated in the latest rally attempt in the Oil Services.

The others:
ICE - Has had an incredible run and the trend has broken. PEG of 2.19 looks a bit overpriced. I'll be looking for potential bearish entries on this on a bounce down from 135 or a break of 125.

NTAP - It had a strong reaction to the recent earnings announcement in February but couldn't follow through and with the market selloff on the 27th, it gave back all the gains from the earnings jump. 36 remains important support, recently confirmed by a nice hammer formation. But once that breaks, things don't look good. Again, this has a high PEG of 2.24. Institutions own 87% of the shares outstanding on this stock. Once they start selling, look out below.


HWAY - This stock has just been boring! The fundamentals are still quite good, but I'd like to get rid of it if or no other reason than that it trades well below an average 1 million shares a day. As a result, there's not a lot of open interest throughout the options chain.

VSEA still looks to be a reasonable valuation with strong fundamentals. So I don't see great fundamental reasons to take it off the list. But I'm nervous about the chart. It has seen great gains in the last 8 months. More impressive is the strength of its chart compared to the SOX index in the last 4 months and it is now working breaking recent resistance to an all time high. But the chart looks like it could be ready to roll over. It broke a long term trendline in January and rallied back up to find resistance on the underside of that line. It now looks to be in an ascending wedge, which tends to resolve to the down side. With a big bearish engulfing candle strengthening resistance at 50, a reversal could be at play here.


CWTR - Though the fundamental scores are still pretty good and the valuation is actually quite attractive, I think this industry comparison chart says it all. GONG!

RIMM is pretty expensive, but it has held up impressively in the recent market selling. We should wait to see what happens at the earnings announcement on April 4. Or maybe we should not include stocks over $100. Thoughts?

In Summary, here is my recommendation for the list:
KBH Cut
UNT Cut
ZMH Cut
CRDN Cut
WCC Cut
BHI Cut
ICE Cut
NTAP Cut
HWAY Cut
CWTR Cut

Keepers(for now)
VSEA Give it the benefit of the doubt until it breaks down
RIMM Hold 'til earnings, at least
COH This actually has 3 green arrows right now
AAPL Apple rolls out a bright iFuture
CTSH Just ranked 15th in the Businessweek 50 best performing companies. Setting up for a new batch of green arrows.

So how does that strike you? Please let me know if this assessment of things is agreeable or if you see certain stocks differently than I and would like to take different action. Once we agree on the stocks to get rid of, we can begin to find replacements. We still have over a week until our next meeting, but perhaps we can get some ideas flowing between now and then. If you respond with ideas, I'll try to respond and include charts. If you want to mock up a chart with what you're seeing, I'd be happy to post that too on that blog.

Sunday, February 4, 2007

List Performers

Since this post followed so quickly after the last one, I just wanted to point out that Jim left an insightful comment in the comments area for the last post on Oil. Check it out. And don't be shy about leaving your own.

So far, the 40/45 March Bull-Put spread on COH I suggested a few posts ago is looking good. I'm not going to claim victory just yet, as there's plenty of time before expiration, but it's nice confirmation when things begin to work as predicted from the start of a trade. (I'm paper trading it, so I'll let you know how it comes out.)
COH has put in a new high now and while it may keep firing higher, it would be prudent to look for a cleaner entry. The MACD and Stochastic have yet to turn lower, but I would imagine one or both will in the coming week as the stock regroups for further upside. With 5 up days in a row, it is reasonable to think there might be a bit of a healthy pull back needed. Also, I like to keep old trend lines on charts for a while to see how the stock reacts to the backside. You can see that the stock is coming right to the underside of the recently broken 5 month trend support. Given the angle of the line, I don't see it as some scarey point of reversal. It just seems a healthy reminder that stocks aren't supposed to go Parabolic and this one could use a few days rest. If it pulls back toward the MA and puts in a higher low, that would be a great entry. I will look to 45 for new support.
(Click for a larger view)


CRDN is in a group seemingly trying to fight its way out of the red. Notice that the Group Rank in Phase 1 is showing 64. After not a lot of follow through on selling after an analyst downgrade, we see a potential double bottom reversal pattern which would give a nice buy signal in a move above 55. This would also be very close to a fresh third green arrow on the MA. With earnings on Feb 26, this could be a nice short term trade up to 60 or so.


Earnings coming out tomorrow on CTSH and the chart looks very healthy. Of course buying on a pull back would be ideal. There's very nice, clear support at 82.50. Use this to define your risk and position size.


I'm feeling good about replacing ISE with ICE. Friday marks a new high for ICE on above average volume while ISE had a down day to erase much of its rally attempt the prior day. We'll see what earnings this week bring for these stocks.


The homebuilders have been doing very well lately and our KBH has been moving right along with the pack with a new high for the last 8 months on Friday. It's not quite ideal to buy after a week of very strong action. But the strength serves as confirmation that people are continuously embracing these stocks again. A target of 60 seems inevitable in the coming months. The trick is to get the entry correct.


RIMM has been moving sideways lately with some very toppy signals to it. The recent earnings announcement was met with a heavy volume and huge bearish engulfing pattern. Then a rally attempt at new highs was harshly batted down from resistance on big volume again. A few noticable up days this week look like another attempt is being made, but the volume has been less than average on those days. I won't have a whole lot of hope for this stock until it can convincingly break through the 140 area. Until then I will be looking more closely for a potential bearish position here. Obviously a bounce down off the 140 area for a triple top pattern would be a nice entry.
Paper Trade: On December 22, the day after the earnings announcement, I used the bearish engulfing as a signal that sentiment on this stock was changing. With a lower high also in place, I sold a January 140/145 Bear Call spread for a credit of $1.47. It expired worthless for a return of 41% in 4 weeks. The first week of January was a bit worriesome, but I held because it had not broken the resistance yet.


WCC had a stellar earnings announcement accompanied by news of a $400 Million stock buy back program. The market obviously liked this with some heavy volume gains. Notice that the day before earnings were announced was already an optimistic move. At this point a pullback would be a better place for an entry. 62.50 would be a good support level or maybe the MA will come up to provide support somewhere else. A move above the 69-70 area will be the real signal that this stock is going places.


ZMH is pulling back for a nice entry. 80 would be the most obvious, perhaps strongest support to look for now. But an entry on a bounce of the 82.50 level, the low of the day it gapped up, would be nice and clean. Don't forget the big volume spike that accompanied the gap. This is a major sign of sentiment on this stock.


But don't forget to look at the long term chart on ZMH. The 90 area appears to be potential resistance. What I'm thinking is that it might be nice to buy stock or a deep ITM, Long term call option here around 80 or 82.50 and then sell 90 calls as it approaches that level if it struggles with resistance there.


Have a great week.

Monday, January 29, 2007

Handbags, anyone? - COH, Knee implants? - ZMH

Looking through our list, COH appears to be the most buyable at the moment.
The Industry group is looking good in the green on the big chart. The group chart is pulling back a bit after a very strong move since July. In the last six months, COH has considerably outperformed its group.
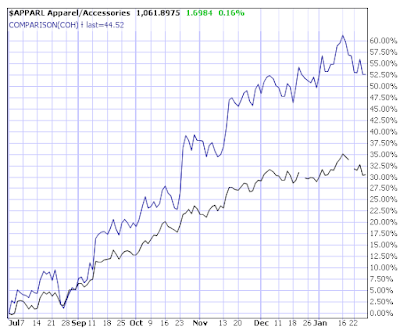
If the market and this group continues with strength, it would be a good bet that this stock would remain a leader. They just came out with earnings beating estimates for the 5th straight quarter.
The fundamentals are looking very strong here. The 5 year annual growth estimate at 20% is a touch lower than we'd like, but the ROE(Return on Equity) of 40 is very favorable. The brief run down from the press on the earnings announcement looks pretty nice. Sales in Japan grew 17%, (I assume that's year over year) and they're adding 10 new stores in Japan for a total of 20 new stores in 2007. Using the estimate for annual earnings in the fiscal year 2007, it now has a PEG of 1.24, which is still pretty attractive for a leading stock.
The day of the earnings announcement there was some odd intraday action, but it formed a Dragon Fly Doji, much like a hammer, that was confirmed with a bullish engulfing candle the next day. This coincides with the MA acting as support as it did twice in December. While the trend has clearly flattened out a bit, an entry here would put us closer to support levels where we might choose to use for exit points to the down side. Considering the potential sideways action, one might be inclined to wait for a close above the 45 area, which has been a minor point of resistance lately.


So what do we do with this, particularly considering the market is looking a bit ify right now? Buying the stock here would be pretty reasonable since it is so near support. Even with the uncertainty in the market, a tight stop under 43.50 or 43 would be reasonable with a plan to use one of those two support lines as an exit. But where's the target? Obviously a near term target of the recent high at about 46 or 47 would be reasonable. And looking back at the average distance above the MA in the last two years, I'd say somewhere between 3-4 pts. With the MA now at about 44, I'd say 37 would be a reasonable near term target. But for a longer term trend ride, I can't see why at least a nice, round number like 50 shouldn't be in the cards. So to play it as a regular stock buy, you'd have to decide if you're comfortable with the risk/reward and whether or not you'd want to look for a quick profit or to let it ride for a longer term trend play.

But let's consider some ideas using options. There doesn't quite seem to be enough juice in the options chain to make a covered call buy-write very attractive. Look at how the IV dropped very quickly after the earnings announcement. You may remember my mention back in December that this could be a good stock to play a run up into earnings and the accompanying rising implied volatility.
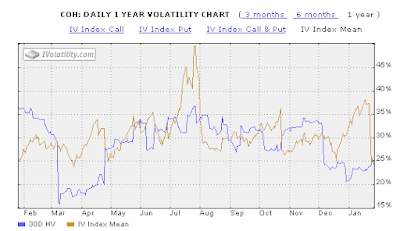
Buying the stock now and selling the March 45 call for 1.50 would bring a profit, if called out, of under 5%. Depending on how close you'll choose a support level to use as an exit, that might not be the most attractive risk/reward. What would make it more attractive would be buying a deep ITM call instead of the stock itself.


Buying the May 32.5 for 12.80 and selling the Mar 45 for 1.50 would technically be a "Diagonal" spread with options from different months with different strike prices. But used this way, it is essentially like a covered call. This position would cost $11.30 and bring a potential profit of 1.20 or 10.6% return on investment. The real question is whether that profit is worth what we'd be risking if we sold on a break of support. I think it's pretty debatable. But don't forget about the possibility of selling the following month after March expires if we're still somewhere under 45. What I'd be more inclined to do along these lines would be to buy the May 32.5 and wait until the stock moves a bit higher to "leg in" to a covered call, selling maybe the 47.5 or even the 45 for a higher premium.
Looking at the potential with vertical spreads, hedged positions buying and selling different strike prices but in the same month, the bull-put credit spread doesn't have enough premium in it to make it worthwhile, even further out in March. Using the support levels we have beneath us, it'd be nice to sell the 42.50 strike price, but a 42.50/37.50 March put spread would only bring in .60 for a potential return of 13% on the money at risk.
But what if we looked at doing a vertical spread with directional bias. We can do virtually the same spread with either puts or calls, buying the 40 strike price and selling the 45.

Here is the options chain for these 5 pt. vertical spreads. Because they are 5 pts. wide, the most one can ever make or lose is 5 pts. minus the credit or debit of the spread you opened.
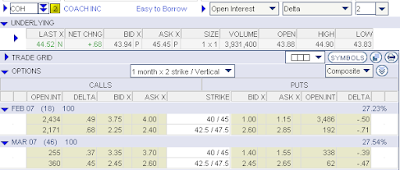
Looking at the Feb spreads, buying the 40 call and selling the 45 call will cost $4 with a potential profit of $1. If we use 42.50 as a trigger to get out of the trade all together, the loss would be about $1.50 because we know that the 40 call will have at least 2.50 of intrinsic value in it. Depending on how close it is to expiration, there might still be enough time value in the combined position to make the loss less than that. Of course, you could use 43 as the trigger to get out or even 43.50. But giving it room to move with a trigger at 42.50, we're risking about 1.50 to make 1. That's not bad at all considering the high probability of the win. The stock only needs to move up .50 in the next 18 days to get full profit. Notice that the same position in puts, the Feb 40/45 put spread, selling the 45 put and buying the 40 put will bring in a credit of $1, exactly the same.
If we want to be a touch more conservative we could give it more time. Using a March spread will both give us more time for the stock to go where we want it and will get us a better profit potential(and smaller potential risk) because there is more time value(fluff) built into the options we would be selling.

Buying the March 40/45 call spread costs 3.70, leaving a potential profit of 1.30, the balance of the 5 pt. spread. But selling the March 40/45 put spread would bring a credit of 1.40, a better potential return on the money at risk.

Investools seems to teach credit spreads as something to be used only selling the short strike price out of the money and behind support of some kind. But notice here that the credit spread that is actually a bit in the money here is more attractive than the debit spread. Also, one of the benefits of the credit spread(though very dicey) is that you can "reverse" the trade.
For example, with the March put spread, we'd be buying the 40 and selling the 45. If the stock suddenly broke through support in a dramatic way and with volume, we might expect it to go much further. We would then have a few choices: We could close the whole position for a loss. Or we could buy back the 45 put for a loss and let the 40 put pick up value as the stock continues to fall. If it goes far enough, the profit from the 40 put will compensate for the loss taken on the 45 and we might even end up with a net profit on a trade that went the wrong direction.
I want to emphasize that this type of trade reversing is very tricky and has further risk involved, but it's something we should understand as a possibility going into a trade. I'll do a post soon about a trade reversal I made on BHI. It was a successful fix, but more often than not I've screwed things up worse when I've tried that.
In conclusion, it seems to me that this is a tough options chain to deal with because there's not a lot of fluffy premium to sell. I would probably be more inclined to buy the stock or a deeper ITM call and look to leg into a covered call or diagonal spread. Or doing the March 40/45 bull-put credit spread(slightly in the money) for a potential 38% return on risk if the stock moves up .48 by March expiration.

I hope that all wasn't too confusing. There have been very comments/questions left on this blog. If any of this is confusing or brings up questions or thoughts to share, please do not hesitate to write them in the comments section below.

In other news, ZMH reported solid, estimate beating earnings today after the close and raised the outlook for 2007. Strangely, before the announcement, the market had already begun a strong bounce off the MA and trendline support for a break above resistance on volume well above average. Perhaps people are really interested in this one. Industry group is in the red on the big chart, though the group's chart looks quite strong still.
The F/E score is just at 3.25 our minum with the Estimates score at 2.75. Not quite the forward looking strength we'd like to see. Can you account for why the Estimate score is that low? I can. How to figure out the scoring is in your manuals.


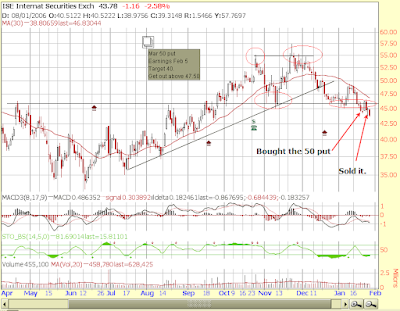
Our old friend ISE appears to be following through with the double top pattern, if a bit sheepishly. I'm pretty sure I've mentioned this pattern on this stock a few times already. Earnings come out Feb. 5, so use caution before then.
Notice the little note I put on the chart. On 1/22 I bought a March 50 put. Looking at the chart action, I chose 47.50(around where the MA was) as a bail out point but got out early because the candles seemed to be telling me that support at 45 was going to hold. I closed it 1/26 for a small loss after seeing a morning star formation at support and then a Hammer on the day I closed it. Perhaps I should have waited for confirmation on the hammer with a close higher. That didn't happen. It went lower and I would be profitable right now. Grrrrrrr!

Lots of important economic announcements this week, especially the FOMC meeting statement on Wednesday. So be careful out there.

Saturday, January 6, 2007

Some Trades

I know I said I'd do a look at some of the sector indexes, but with an erratic and short first week of 2007 behind us, I'd rather wait until we have another full week under our belt to get a more settled look at what's doing in the market. In the meantime, the first three days of trading in 2007 were quite jumpy and on considerably higher volume than the holiday period. We talked about the relative weakness in the Nasdaq and particularly the Nasdaq 100. Yet those indexes actually gained on the week, the NDX(Nasdaq 100) getting back above the broken support line....

...while the SPX and Dow both were down. What is most striking to me is that the SPX closed right at the horizontal and diagonal support lines that I've had drawn on my chart since the prior week. It's just weird when that happens. If this 1410 area is broken, this will be bad news for the short term. We already have lower highs and lower lows on an intraday basis, but on a closing basis, this would be a clear lower low. After 1410, I would see the 1380 area as very important support for the intermediate time frame.
(click for bigger picture)

All this is to say that the markets are still giving us pretty mixed signals and though we may be on the verge of something significant, we haven't broken yet. A crucial thing to watch will be the VIX index. "When the Vix is low and starts to turn up, it's time to go." The weekly action on the VIX shows a doji star with a fairly wide range but small body. It closed up somewhat for the week, but still hasn't broken above the very significant level just under 13. If that is broken while the SPX breaks 1410, I would see this as a blatant signal to turn bearish, at least in the short term.


This article is an interesting look at the sell-off in commodities as a signal for economic slow down. The basics of it make sense and its nice when big talk on the economy makes sense to the average civilian like me. Also, it's worth mentioning that the Wall Street Journal pointed out this morning that we haven't seen healthy correction (10% pull back in a bull market to keep it from overheating) in the Dow or SPX in several years.

One member mentioned at the meeting that we spent a little too much time on the market posture rather than looking at individual stocks. It's a reasonable comment. Of course, what matters most is what is going on with the individual stocks that we have our money in or want to put our money in. But it is crucial to always stay in tune with the broad market indexes because when they are at potential turning points, if they do turn, each individual stock will drastically change its tune even if it has been performing very well. Strong stocks on the verge of breakouts and further advance will, at the very least, wait longer to make their move. At worst, they'll see profit taking as people want to reduce their risk. I try to think of the market as a bunch of people standing in a room watching what each other is doing. When the selling gets going, most people will join in and follow the crowd. Look at the run up and sell off in GROW. I think it's fair to say that this was all the momentum of people piling on to the buy side of a super hot stock and then all bailing out as the momentum swung back to correct the move.


Here are a few trades I've done recently on our list.

COH December bull call spread. Purchased on October 30 for 3.80 with the stock at 40.08.
This chart from that day shows my analysis and entrance was made on the most current daily candle of this chart. The mention of short sellers is because I'd seen that short interest had decreased over those months.
(Click image to see it bigger)

I rarely do a debit spread but am realizing their appeal more and more. Credit spreads, of course, have great appeal, but they serve different situations. I did this one because a credit spread only makes sense to me if there is a support level between the short strike and the price at the time. In this case, I did the bull call spread because I saw a potential pull back to one of two support levels between 35 and 40. If it would pull back enough to make it worthwhile, I planned on buying back the 40 call for a profit and then hold the 35 call for the expected bounce back up. That's also why I bought the December spread, to give myself a bit more time in the long call if I went that route. It ended up not pulling back very much and I never bought back the 40. Of course, when the stock started moving, I wished I wasn't in a capped profit position, but I was happy to just let time decay for the position as long as it stayed above 40.

On 12/4, I sold the position for 4.85 because I realized that even the max profit on the 1 contract spread would not justify the commissions for exercising the options. It was more profitable to take slightly less than the max potential profit and pay only the small commission for closing the position. I could have waited a couple weeks longer and maybe gotten .05 more, but I was happy to just close it and move on. (Think about it. What market maker is going to by a $5 spread from me for $4.95 for a profit potential of .05?) In the end, I made $.99 or a 26% return on $3.80 investment including commissions on a stock that didn't have to do anything but go sideways or up from where I initiated the position.

I mentioned in this post a BHI bull put spread I placed. I'll follow up on this one in coming days, since I reversed it and went through the whole dicey process of trying save a bad trade. This will take a whole post in itself, so I'll leave it out for now.

On the second post of this blog, I did a detailed analysis of ZMH and proposed a trade on it. Two days later, I opened a paper trade.
On 12/7 in the 11 o'clock hour at 75.03, I bought a Jan 70/75 bull call spread with a fill at $3.58. Again, I did a bull call instead of a bull put credit spread because I saw the possibility of a slight pullback and prefer credit spreads when there is clear support between the price and the short strike. But with my analysis of the stock and the healthy trend, I was comfortable to get in, let time(theta) decay, and trust that it would close above 75 at Jan expiration. A break of the uptrend support line would have been a good place to exit for a minimal loss. I say minimal because as the 70 call would lose value, so would the 75 call, offsetting each other to a good degree. But let's say the trend line was broken and we got out of the position with the stock at 73. The position as a whole would still have had $3 intrinsic value and time value on top of that. So I think it would be a minimal loss, definitely no more than .58.


I sold the spread on January 3 when the market was selling like crazy and this stock showed a severe looking bearish engulfing pattern. Even at the time, I realized that it had not yet broken the uptrend support line, but I didn't like the smell of the market and didn't want to risk giving up any more profits than I had to. I was happy to close it for a decent gain. 23% return on investment not including commissions.

Last month I mentioned a potential bull put spread on ISE in this post with accompanying chart on a bounce off the trend support line. I paper traded this Jan 45/50 bull put spread entering the next day, 12/18 at noon for a credit of $1.65 with the stock at 49.78. This is a bit unusual for me, since the short strike was in the money, but with the trend line so close I knew it'd be either up above 50 or would break the support line in a very short order. Therefore this issue should be resolved fairly quickly. I failed to see the high volume selloff before the bounce as a warning signal. Or maybe I did and that's why I only paper traded it. I'm generally less on top of my paper trades than real trades and didn't close this for a couple days after the support was broken. In any case, with a debit of 2.85 to close, the loss was $1.20. The positions was sized for the max loss potential of $3.35, so this was well below my maximum acceptable loss.


One of the difficult realities of spread trading is that they have a much higher probability of success, but a much lower profit potential. So one must understand and strike a balance between these two aspects in order to be profitable in the end of a number of spread trades.

For those of you still new to the market and trading, I strongly recommend sticking to getting a strong grasp of basic fundamental and technical analysis of stocks and learning how to plan and manage simple directional stock trades first. If you don't know what you're doing with basic stock analysis, you definitely won't have a clue how to deal with the stock's movement affecting a more complicated spread trade.

Another paper trade still in progress is a regular stock purchase on VPRT, a stock I've mentioned at a meeting or two. Bought on 12/11 a 32.52, I was anticipating the formation of a handle to complete a cup and handle pattern before the stock powers through the official buy point above the highest point on the right side of the up. That is where there would be no more "overhead supply" or sellers. So let me be clear that this was not yet an official buy according to the O'neil teaching on cup and handles. But if it does clear the buy point, the target would be roughly 47.50, using the depth of the cup as a target distance from the buy point.

But aside from the potential cup and handle pattern, it was in an intermediate term uptrend and bounced off of old resistance, confirming new support. My stop was set just below the round number of 30 at 29.95 and the position was sized for that distance. The support was breached, but not in a convincing way to me with volume decreasing on the selloff and I thought the intermediate trend line, the potential pattern, and the well received earnings report in October deserved the benefit of the doubt. Notice the big volume selling day on the 15th has a good sized lower shadow indicating buying pressure as a significant part of that volume.

As of right now, the intermediate trend is still in tact and I will get out on a convincing break of the uptrending support line, particularly if the broader market continues to look weaker. It is worth noting that it is perhaps expensive here with a PEG of around 2.

That's all for now. I'll try to get that BHI trade a maybe a few others up in the near future. I the meantime, please leave any questions or thoughts about what I've written here in the comments section just below. Hope you're enjoying the beautiful day today.

Thursday, December 21, 2006

Scrolling through the list

As the Nasdaq is looking ever more questionable and the SOX has definitely broken its uptrend support line, AAPL seems to have broken down in perhaps a very significant way. It has Definitively lost the horizontal and diagonal support and now it looks like the 50 MA too. That makes three strikes. Next likely support is at 78. The 200 MA is all the way at 70.

(Click images to see them larger.)


BHI is holding above 74.50 support and the 200 MA. Yesterday's inverted hammer made a bullish Harami.


The continued strength from COH warranted a mention from Mike Coval in Wednesday's Market Commentary.


CRDN is in a bull flag and holding above the 20 MA.


CTSH has a trend that looks a little long in the tooth and might be ready to break its Uptrend support and the 50 MA in one shot.


CWTR doesn't look very pretty and just bounced off the underside of the 200 MA. Chart shows a couple bearish divergences with the MACD in the last year. Interesting to see how common these are and how powerful a signal they seem. Here's an article on the subject.


HWAY looks to be warming up to breakthrough the 200 MA with the help of the 20 MA and support just below at 46.50.


ISE looks more likely to test the 200 than climb back up to the 50. The intermediate uptrend is coming in jeapordy with a test of the latest low.
A few posts back, I suggested a 50/45 bull put. I paper traded it and on the break of the support line closed it for a small loss.


KBH seems to be respecting the 200 MA and looks inclined to use it as support now. There is decreasing volume on the pullback from the recent high.


NTAP is right a the crux of testing horizontal and diagonal support and shows a potential double top with a bearish divergence on the MACD. Volume spikes recently have been on buying days.


RIMM had earnings today after close. There are a lot of writers pointing out overvaluation. The stock has more than double since August. But with earnings coming in at a penny more than the analysts' expectation, the stock was up over 5% after hours. Here's a good summary of the announcement.
With a fresh bounce off the 50 MA, if Friday closes up above 141, this could be a nice bullish entry for further upside movement. A Bull Put spread might be a nice conservative approach.
Implied volatility on RIMM ran up above 55% into this announcement. Perhaps there will still be a nice level of it to sell tomorrow.


UNT still has a longer term downward bias, but may find support at 48.80 and its 50 MA.


VSEA broke out big today, 5.7% on a day when the SOX is down 1.3%. Only news I could find was of a live webcast for their coming earnings announcement in January.


WCC looks to be having trouble. Continued selling today on big volume. 56.50 is likely support. Peter R. at Shadow Trader always says that volatility contraction leads to volatilitiy expansion. Notice the three Moving Averages coming together over the past few months. With the price now below the 200 with the others likely to follow, could this be the beginning of a more meaningful move down?
Perhaps a bounce a bounce off the 56.50 area support level could be played with a bull put spread for a bounce with the intention of buying back the short on continued breakdown.


ZMH wants to go higher though couldn't quite make it beyond resistance today and formed a shooting star which technically still needs confirmation, though the past few weeks have shown a number of bearish candle patterns.


It's interesting to look through the list and find that I'm still bullish in the short term for 10 of the 15 stocks. However, some of those "bullish" stances could easily change very soon: NTAP, CTSH, CRDN