Showing posts with label VIX. Show all posts

Saturday, December 1, 2007

Market Posture for the Holidays. Feel the spirit!

I like going through the market posture on the weekends. Not so much because it's so different from a day or two before, but because you can look at the bigger picture using all complete weekly candles. Looking at this way tends to smooth out the noise of each individual day and somehow makes the process a bit easier and perhaps more objective.
Here is the Market Posture Grid as filled out at Thursday night's meeting.
(Click on image to see it bigger.)


Below is the weekly chart for the SPX. It's hard not to notice that there is a very clearly formed double top formation in process. But like any pattern, it's just a potential pattern until it is complete which is when the support line is broken in this case. It's also very apparent that the higher high is less of an improvement than the previous higher highs. Same with the higher low, and on the daily chart it's more of an equal low. Nevertheless, the intermediate posture on the SPX is still arguably neutral due to no major lower low and still having no major lower high despite the clearly bearish short term trend. What further supports an at least neutral intermediate posture and potentially bullish short term posture is what looks like a possible short term reversal at significant support. This week's candle is clearly bullish(engulfing and then some).
Thursday night we spoke about potential points of resistance to look for in this market rally. Having been a very significant point of support and resistance many times in the last five months, 1490 seems the most obvious level. Interesting to see the rally peaked out just a dollar short of there intra-day on Friday.


The weekly VIX chart also shows some reason to be bullish at least for the time being. The long term trend in the VIX is clearly up and this is a long term bearish indication, but remember that it is the intermediate and to some extent short term that we should be most aware of, as the "long term" shows us what has happened somewhat long into the past. The Intermediate and short term will give us a better idea of what to expect for the immediate future.
On an intermediate time frame, we have a lower high even if just slightly, and a lower low from mid August to late September. Looking a the bearish reversal candles in beginning November, we see that they have been confirmed in the past week's lower close. Furthermore, this week, we got the important piece of the puzzle we were waiting for which was a lower low on the short term VIX, a movement below daily support(and former resistance) just below 24.


For the final component of the Market Posture routine as taught by Investools, the Market forecast is giving us a clear bullish reading on the intermediate term with the green intermediate line having moved upward out of the lower reversal zone.
There is also seen one of the major "signals" that the Market Forecast indicators give which is the "Near Term Divergence." This is where the blue Near Term line puts in a higher low while the SPX itself makes a lower low(opposite for a bearish divergence). As with any signal, it doesn't tell the future or work out every time, but in this case it has worked out at least short term.
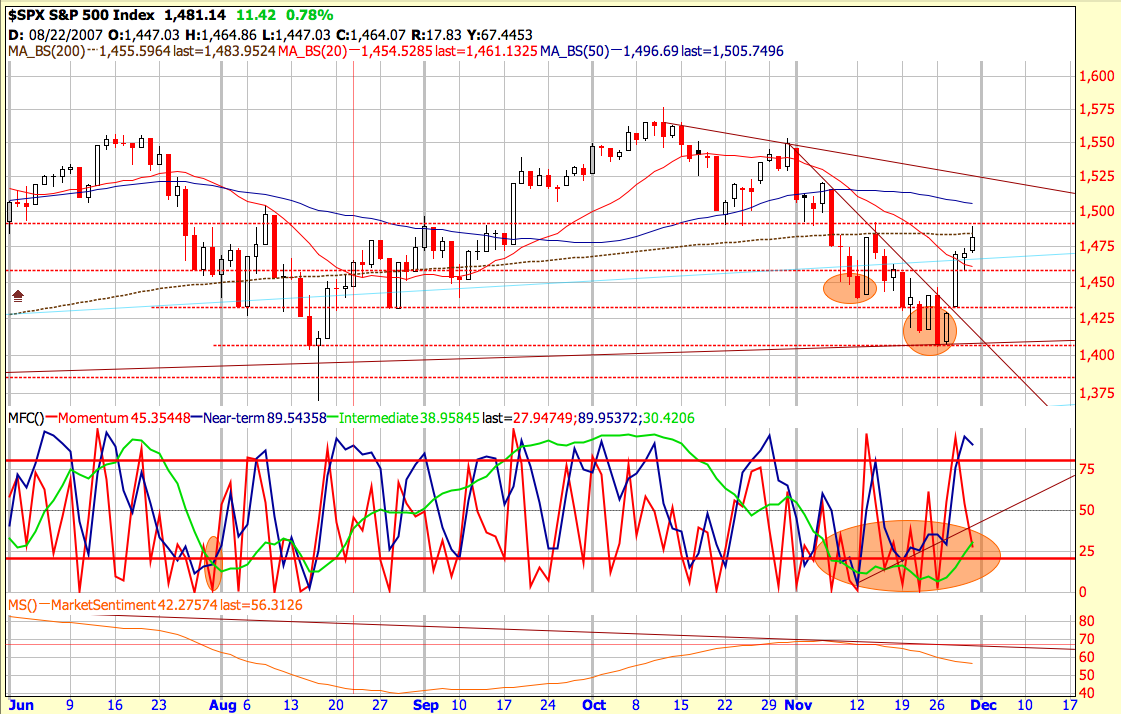

It's hard not to feel the fear in the air and even to notice that the SPX is still under the 200 MA even with the rally of the past week. I'll let you do the process with the Nasdaq, but it's interesting to note that doing the three pronged posture in as objective a way as we could, we came up with a Bullish posture for the Nasaq and Neutral for the SPX and only then looked to note that the SPX is below the 200 MA and the Nasdaq is above it. Perhaps it is not earth shattering news, but noteworthy nonetheless.
There are certainly lots of things to be worried about with the economy and even the charts. But there are also potentially positive factors for the market, so who knows?
I won't list the negatives, but as for a few potential positives from one who is FAR from an economics guy, how about oil prices finding a potential top?

How about the weekly bearish engulfing on the Yen at long term resistance? It may be short lived, but it looks like it needs to come back in a bit before moving higher if that's going to happen.

How about the plunge in the US Dollar coming to a halt at least for a while as is shown possible by the bullish engulfing candle on the weekly chart? It's awfully far from the 40 week MA.


This may be grasping at straws, or however that saying goes, but the home builders have just been relentlessly hammered for a long time. Even if the outlook is still far from rosy for them, an end to the plunge is inevitable at some point. We know that all homebuilding in the US will not come to a complete stop and therefore the homebuilders will not go to zero. (All you gloom and doomers, yes the apocalypse is the exception.) Though far from a convincing bounce just yet, we do have a bullish engulfing at an old support level and even bullish divergences on both the MACD lines and the MACD histogram. I can't remember who, but I believe someone from the big name investors out there announced taking a major position in one of the homebuilders this week.


For an even more thorough feel of what "The Market" is doing, I encourage you to build a watchlist of the Sector Spiders. 9 ETFs that as a general snapshot show you the action of the market in 9 clumps of related stock groups. There are many ways to look at the sectors of the market and the "sectors" seem to be defined differently by all, but this seems about as quick and easy as any. Notice that the XLF put in a monster bullish engulfing on the weekly chart with its highest weekly volume to date.

I do realize that my showing only the positives and not the negatives seems an awful lot like being a bullish cheerleader. But really, I just want to focus on the positive a bit, because all we've heard about lately is the negative.

There is, without a doubt, downward pressure on the SPX and tough resistance at 1490 even with this week's rally. I will look to 1430 (support from the inverted head and shoulders in August) for a potential level of support. Just about all of the above will probably be null and void with a decisive break below 1406. With a real break below 1375.......Look out below.

Saturday, August 11, 2007

Big picture posture

I don't normally look at the Dow too heavily, but with all of the talk about global expansion and the industrials outperforming due to their exposure to overseas growth, it's interesting to consider the Dow in addition to our normal go-to indexes.
Though the breakout to recent highs did breakdown and ultimately "fake out" fairly quickly, there is still a strong and in tact long term uptrend with a trend support line just below us. If that doesn't hold, the next likely area of support would be 12,750. After the recent craziness and fear as high as I can remember in recent years, is the Dow really likely to fall another 500 points in the coming weeks? Remember, the crowd usually gets it wrong, or so they say. I suppose it's possible this level will break and the quick drop to 12,750 could happen. After all, it's really only 4% and would actually finally achieve the 10% correction that so many have longed for. But again that is a strong and healthy long term uptrend in 30 mammoth stocks that don't just get going or turn on a dime. Even if we are destined to test that area for an "official" correction of 10%, the past two weekly candles are pretty major inverted hammers, showing an inclination to bounce. We shall see.


SPX is also still in good looking long term uptrend, though the breakdown after the fake out of the trading range at the top does seem a bit more severe. The trend line from the mid '06 lows is pretty much broken. But there is almost surprising support from the old channel resistance line in blue. Also the weekly candle shows an inverted hammer like the Dow. If this area doesn't hold, the next likely area of major support is 1,380. After that, all the way down to 1,325. The first level would be roughly an 11% correction from the top, the second would be almost 15%.


For a closer look at the SPX, I'm going to be a bit obnoxious and put up a chart with way too many indicators and lines. Basically, I just don't want to do a third SPX chart. One thing that I think is quite interesting, though I'm no Fibonacci pro, is that the low from last week that provided intraday support again this week is right on the 38.2% Fib retracement line, the first of the most significant retracement levels. The 200 MA is also providing support in addition to the diagonal and horizontal support lines present on the weekly chart. In total, there are 5 support lines of one kind or another, including the fib line, around the current price.
The Market Forecast indicator is actually quite bullish, save for the longer term sentiment indicator, which is heading down with plenty of room to go. But after last week's cluster, the intermediate term green line has exited the lower reversal zone for the official green light on playing the cluster. To strengthen the bullish argument being given there, the momentum and near term lines are lining up for a nice "Intermediate term confirmation" signal, another of the signals Investools teaches on these indicators. In short, the two shorter term indicators line up to be the wind at the back of the intermediate term line.
In short, I'm expecting a bounce here. But the real test will be when the index tests the bottom side of the old support and recent resistance line at the 1490/1500 area. If that holds as resistance, we'll likely see some serious sideways choppy action for a while or possibly another leg down and potential beginning of an intermediate term downtrend.


I think I showed VIX with a weekly chart last time, so I'll just stick to the daily. It's rocketed only higher and seems very likely to come in some. Even if it is destined to go higher, there needs to be some kind of retest of the new range support. I just can't imagine the VIX going parabolic without a true market crash happening. Regardless, it is clearly telling us that fear is high right now. It's also telling us to be on our toes for a peak, as once it is high and then turns, THAT is the time to buy. So my take is that this is very close to being a bullish indicator right now. One point of interest from this past week is Wednesday's action. Though the SPX had a big strong up day, the VIX did not have an impressive down day and actually couldn't break below the recent support/old resistance level at the 20 area. I took this at the time to mean that the up day in the SPX was not to be trusted because people were still buying puts heavily. But really, just look at that Doji star hanging up there. Can it really go higher in the next few days? Of course it can. But is it likely? I doubt it.


The Russell 2000 small caps index has shown much relative weakness in recent weeks, but this week was quit strong. With what we could call a bullish engulfing weekly candle, it seems to not want to give up these support lines, both diagonal and horizontal.
With all the talk about how strong the Big Caps are, could this be the time to get into small caps? The long term view seems to indicate so.


Again, I'll leave the Nasdaq up to you. But here's my thinking. The Dow still shows the most relative strength. The SPX, with many more components to it, is still strong in a long term sense, but the short term is looking a lot more shaky. If the Russell and the small caps bounce from here, the small caps may finally wake up and actually provide a bit of support to this market. I would think that would only help the SPX regain its composure next to the Dow.
Take a look at the Nasdaq versus the Nasdaq 100(NDX). The NDX looks stronger than the composite as a whole, which makes sense considering the NDX is the 100 big boys. If the smaller guys, many of which are surely in the Russell 2000 can get it together, perhaps the Nasdaq composite can work its way through the congestion of "overhead supply" it has to deal with.

Any comments? I dare you.

Bueller?

Thursday, August 2, 2007

Market Posture, again. :)

My Gosh! Is it really over a month since I posted a blog? Interesting, though, to read the last one. Not a bad read on things, I think. And VSEA has done well since then. Today was a seeming breakout that I almost bought. But because it was a resistance breakout with less than 150% average volume, I decided to pass, particularly considering the shaky nature of the markets at the moment. There was a lot of buying going into close, but in after hours it sold off a good amount of the day's gains, even if on low volume. It remains one to watch.

In any case, here's the rundown on what we came up with for the Market Posture. I want to remind that the intention is to come up with a posture for the intermediate term, meaning not what's going to happen tomorrow, but what we might expect in the coming months. And also, because this was a tough one to call, I want to emphasize that technical analysis is as much or more art than it is science. Therefore, we will all see things a bit differently. Because I was leading the exercise, it is of course skewed toward my take on things. Others had at times slightly different views. Whoever is doing today's Market Wrap on the Investools site might have a totally different view. There is no "right" answer. We're each entitled to our own interpretation of things and should become well practiced in making such interpretations. That's the whole point of the Investools education.
Without further ado:


SPX:


On the shorter term, while the recent downdraft feels awfully bearish, there are quite a number potential support lines just below us now. Furthermore, though the shorter term and even intermediate uptrend clearly broke, there is still no official downtrend when considering a trend as a series of highs and lows. As a result, the SPX chart was considered Neutral.


Market Forecast, is bearish because the green intermediate line is the lower reversal zone. Market sentiment line also bearish with tons of room to go yet.


Finally, the VIX. The Volatility index, or as some people call it, the Fear Index. Without even looking at it, would you guess from the market lately that fear is high? The Vix surely supports the thought.
"When the VIX is Low (and turns up) it's time to go (sell)." "When the VIX is High ( and turns back down) it's time to buy."
It is high now and possibly turning back down. But it really hasn't yet. But it does seem like a pullback or breather would be necessary for it to surge yet higher right now. Therefore, we called it Neutral.


What is really interesting is to look at the very long term chart of the VIX. This is as far back as the data goes. I remember thinking and hearing in the past year that perhaps the days of high volatility were over. Better technology, more sophisticated markets, better risk control. Perhaps not.
It has moved back above what was for years the floor. As Jim pointed out last night, if the market does bounce from support at the current level and approach the high again, but the VIX fails to get and stay back below the 20 or even the 18 area, than the VIX will probably be telling us that the move is not trustworthy. This would confirm the same message Jim has been hammering away at on the $NYAD, which remains completely broken down from the top despite the DOW still holding up.


I hope this makes sense to you, whether you agree with the interpretation or not. Whatever the case, the most important thing is that you question and interpret it for yourself and don't just accept whatever I or whoever else has to say.
I'll let you go through the process and do the NDX yourself.

Until next time!

Sunday, June 24, 2007

Market Posture

In my last post on June 3, despite the apparent reasons for caution, I concluded that things were still quite bullish. I am trying to reiterate to myself as well as others that a trend or posture isn't "changed" until it changes. So since the various significant levels and moving averages hadn't yet been broken, a trend trader could only assume that things will continue on as usual. Since then, some of the significant red flags have been raised. The uptrend has not yet been broken in terms of highs and lows, but we have put in an equal high and backed off that level, leaving it as a fortified resistance point and putting the uptrend strongly in question. A lower high and lower low will officially change the trend to downward. Until then, we'll noodle more or less sideways.
As for the moving averages, the 20 MA was broken, reclaimed and again broken. Meanwhile, the 50 MA has provided support on two quick bounces. Friday's close was just below the 50 MA, so I'll call it breached but not definitively broken. Will it hold again or finally crack?
You may also notice on your charts that the SPX is now showing a fresh set of 3 red arrows, the second set that has recently appeared since the big run began with a double bottom reversal in March.
Notice also that the Market Forecast intermediate term line (green) is heading down and has exited the upper reversal zone. Obviously, this is bearish for the intermediate term on this indicator. The Longer term orange line is still above 80 but is rounding over and showing potential for a more meaningful downturn, though 80 remains the official signal line to call it bearish.
Keeping things simple, though, we must remember that price is king and the most obvious signs now will be the strong breaking of the 50 and certainly taking out the recent lows around 1490.
(Click imagine to see it larger)

For the third part of the Investools taught market posture procedure, we look to the VIX. I want to emphasize, particularly to ease Jim's mind, that these other aspects of the Market Posture procedure should be looked at as confirming indicators and in no way should be thought to hold more sway or even equal the power and significance of the index price and posture itself.
With that said, last time I suggested setting an alert to go off if the VIX broke above its resistance at around 14.50. That alarm was sounded and the VIX has since dropped back below and again risen through 14.50. This weekly chart shows it most clearly. The bias looks upward to me.

But even if the market doesn't drop and in turn lift the VIX, I suspect that this slightly higher level will be sustained and perhaps with a wider range from the 17 area down to 12.50 if not 14. Whatever the specific numbers for support and resistance on this volatility index may turn out to be, the message seems clear that rise or fall, the markets will be more volatile for the foreseeable future. For the active trader, this is actually a good thing. For the buy and hold investor, maybe not.
I'm not going to go through the whole Posture thing for the Nasdaq too, but for a bit of comparison, here is a view at some of the major indexes with weekly candles. I always like looking at weekly candles because it simplifies the daily noise into a clearer big picture view.
I've left off the Dow Jones, as it closely resembles the picture of the SPX. I've also used the Nasdaq 100 because the composite shows a discrepancy between the TOS charts and Prophet charts and I think the data is wrong. Besides, the NDX is perhaps a better, more focused look at the powerhouses of tech.
Most noteworthy to me is the succession of weekly bearish engulfing patterns on the SPX after the recent series of bull runs. This speaks strongly for the likelihood of a trend reversal. What these matching bearish engulfing patterns on the weekly chart translate into on the daily is a potential double top pattern.
But the other thing to consider from a bullish perspective in these charts is that the tech indexes have not shown the same strength as the SPX and Dow since the highs in February. The NDX and SOX especially are showing a bit of relative strength compared to the SPX. While the SOX did sell off with the rest of the market on Friday, it broke out to a new 52-week high on Thursday.

Could the semis and tech lead the next leg of the bull market?

Other factors to keep in mind:

Crude oil broke above its recent resistance level. From here, up seems more likely than down. You can check here for a longer term weekly chart. But here's the daily.


I won't pretend to be very knowledgeable about bonds and treasury notes. But at the very least it makes sense to me that if yields go up, the appeal of being in stocks is decreased for long term investors. We've heard a lot about the 10 year yield rising lately. It may find some resistance here in the area below 5.5, but this very long term chart going back to '81 shows what might be a very significant long, LONG term trend break forming.


I know I've said this before, but I hope to get a new and improved watchlist up soon.
For now keep eyes tuned to VSEA. After a wild up and down day on Friday, it closed near the top of the range, breaking the recent downtredning resistance and peaked back above the 50 MA.

LRCX also looks interesting, though not as high scoring.
Tech monster Google(with an impressive F/E score of 3.88!) is out at a new high after testing old resistance as new support. If you're interested in getting in this stock and not missing the boat again, this seems like as good a time as any. Remember, there's not that big a difference between buying 10 shares of a $50 stock and 1 share of a $500 stock.


On the downside, REITS are looking weaker and weaker. Some have clearly begun breaking down, others are just beginning to crack now. I'd like to see some of the first to break down come up to test resistance for a better entry.
Homebuilders have seen renewed selling. Banks look pretty weak too.

Have a great week!

Sunday, June 3, 2007

Bullish, Bullish, Bullish, some stocks to watch

Well it seems that it's business as usual. Just when the market gives you pause to think the uptrend might tiring, the potentially bearish weekly candles from last week all got wiped out with a strong week across the board. Particularly encouraging for the bulls is that the Nasdaq and Russell, which I pointed out had been lagging, pushed strongly above their recent resistance.
This image shows the weekly candles for the major indexes since Jan 1. Judging from these alone, it seems that the intermediate to long term trend is still quite bullish.
(Click image to see it bigger)


The Vix remains in its low range. It might be a good idea to set an alert for if it moves above 14.50 or so as a wake up call to assess things.


One observation I'd like to make is something of a cautionary bit. I tend to be a worrier, which doesn't really help in the face of a strong bullish market, but it is worth considering the risk in the air when there seems to be such a strong sense of confidence and perhaps, complacency among the bulls. I think this mockup shows my thinking clearly enough.


The fact remains, as always, that an uptrend is an uptrend until it's not anymore. So everything is all systems go at the moment. But it is interesting to consider the momentum of the last year and whether it might just be waning a bit. Last week's gains were done in a short week(whatever that means) and Friday's finish was on less than average volume.


That said, there's a ton of strong looking stocks out there.
Here's a china play.
CTRP - Very nice 5 year chart with a recent high volume week of an earnings jump. Biggest weekly volume since the end of 2/27 China stock market scare.


It even looks great on the daily chart with the Investools study set. It's looking prime for a support bounce and a set of fresh green arrows.


GROW had some serious volume on Friday for a bounce up and further forming of a potential ascending triangle. It's early to assume that it will bust through the triangle resistance, but a play up to that point would still be a pretty good risk/reward ratio for those bold enough to play it.
The volatility bouncing down from resistance in the last 5 months is unnerving, but considering it was a $2.50 stock just two years ago, maybe this is a very natural and healthy period of consolidation.


Here's another from the investment world.
AINV - It looks like it needs to come in and establish new support here after such a quick upward move, but it's certainly one to watch.


The growth is smaller than we look for, but it is better than its group. Investools has lumped a lot of industry groups together on their recent change to the Big Chart and Industry Group designations. So some stocks, like this one, are compared to a group of stocks that are not entirely accurate as competitors or comparable companies.
This from moneycentral.msn. com.

Anyway, one can quibble about which website is correct or if growth estimates are suitable for one's standards, but a strong chart speaks for itself. The stock is at an all time high after 4 days of above average volume and big moves.

And last, but certainly not least.......
Our very own VSEA!
It's a bit difficult to figure out what the SOX is doing, but VSEA appears to have put in a new support level and it may be ready to resume upward movement.

First the SOX, for your reference. Friday's candle is not exactly what we want to see at potential resistance from a double top pattern.

But VSEA does look nice.


Have a great week. I'm pretty busy in the coming weeks, but I hope to put together a new and improved watchlist for the group. So stay tuned.

Monday, May 28, 2007

Patterns and Sticks in their time, Opera too

I thought I'd make a quick point about candlesticks and patterns in the context of a time frame. I know that candlesticks have been somewhat of a focus lately and we've talked about double tops and bottoms recently, so I thought I'd point out an observation I made this week.
Candlesticks, like chart patterns, are applicable to all time frames and have increasing signficance the larger the time frame. Take a look at this double top formation on the SPX this week. This chart of the SPY shows each candle representing 15 minutes. There is a Double Top reversal pattern that would have worked out nicely as a clear and clean entry point for a bearish intra day trade. There is even a confirmed Hanging Man candle pattern on the second top. One might even consider playing a downward break of the symmetrical triangle in the most recent day for a bearish continuation on an intraday basis.
(Click the image to see it larger)

But would this bearish entry make sense for an intermediate or long term entry? Looking at the daily chart, probably not. Of course, there are plenty of signs that the chart is weakening. My uptrending support line from March was broken and then acted as resistance. The incline of the trend is becoming less steep. This week shows three days with topside shadows followed by a big red candle on Thursday. One could look at this cluster like an evening star formation. It's not textbook, but it tells the same story. With the Investools study set, you will even find that the chart now shows 2 red arrows on the MACD and Stochastic. Nevertheless, the SPX is still in an uptrend and has now found support for the second time in recent weeks at the 20 MA. Though many things may be pointing us to look for a reversal, it is a bit early to call it a top here, particularly when the recent months have repeatedly shown us drastic down days followed by days and weeks of upward movement.

Finally, the weekly chart shows just how the candlesticks and patterns can be used to simplify everything in the bigger picture. It is really quite amazing when you think about the amount of information, news and action that is represented in that one simple candle. This image shows the SPX, DJX, Nasdaq composote, and Russel 2000. The SPX and Dow show very strong weekly candles with the most recent week resulting in a harami, which is a potential reversal. According to Steve Nisson, the Japanese will say that with a harmai the market is "losing its breath." I would say, though, before seriously worrying about a drastic bearish move, we should like to at least see this weekly pattern confirmed with a lower close at the end of this week. For now we must look at these markets in a strong uptrend as taking a very natural breather and perhaps a very healthy pullback.
The Russel and Nasdaq, on the other hand, are looking a bit more ominous. Neither have participated in the strength of the SPX and Dow in the last month and look to be more setup to roll over. The Russell small caps, in particular, have barely found life above the resistance level from late February. Of the "Gravestone Doji" which is seen on the Nasdaq, Nisson says that the Japanese call it this because it "represents the gravestone of the bulls that have died defending their territory."

I hope this is of some use to you. I just want to reiterate that the use of candlesticks and patterns are fantastic but must be appropriately applied to the time frame you are looking at.
On the subject of watching for a reversal, it is worth noting that the VIX has established a very clear level to watch for. Remember, "When the VIX is low(and starts to rise), it's time to go." 14.50 or so seems to be the magic signal for the moment.


So in addition to the ideas from the last post on REITs, Retail may be a good place to look for potential bearish setups if the market does continue to show weakness. We know that our COH has been taking it a bit on the chin lately. But this weekly chart of the $RLX shows a symmetrical triangle that could have big potential to the downside. Having shown relative weakness to the Dow and SPX recently, and with consumers being pinched by the high costs of gas going into the summer season, it would make sense that this sector might take a hit. As is noted in "Week Ahead" found in the strategies tab on the Investools site, Dell, Costco and Sears report this Thursday.


And now for a shameless plug:

As you may know, I am an opera singer.


In case you are looking for a little culture in the coming months, I thought I’d share the information on my performances this summer.
I will be singing in three different operas in June and July. In June, I sing the role of Basil Howard in The Picture of Dorian Gray, a setting
of the Oscar Wilde novel by composer Lowell Lieberman . The music is quite impressive and the cast is a very good group of singers. This is being done with Center City Opera at the Kimmel Center in Philadelphia.

There are four performances but it is double cast, so make sure you buy tickets for one of these two dates when I’ll be singing. For more info on the company and these performances, go to their website.

My performances:
Wednesday, June 6,
8 PM
Sunday, June 10, 2:30 PM

In July I will sing two roles with the New Jersey Opera Theater, performing at the Berlind Theater at McCarter in
Princeton. In Mozart’s Die Zauberflöte (The Magic Flute) I will sing Sarastro, the high priest of the temple of Isis. In Gounod’s Romeo and Juliet, I will sing Frere Laurent, the provider of poison. For information on tickets, go to their web site.
This is one of my favorite pictures from past performances with that company.

The dates for those shows:

Die Zauberflöte (The Magic Flute), Sarastro

Friday, July 13,8pm
Sunday, July 15,
2pm
Saturday, July 21, 8pm
Saturday, July 28, 1pm

Roméo et Juliette, Frère Laurent

Friday, July 20, 8pm
Sunday, July 22, 2pm
Saturday, July 28, 8pm

Both of the theaters where these performances will take place are ideal for seeing and hearing opera in a more intimate environment. I think they seat somewhere around 600 people. The casts are all young, up and coming talent. So there will be no old, tired, park-and-bark singing here. So come on out to the opera!

For a few last laughs, here's a picture of me as Sarastro in a children's production of The Magic Flute in Zurich. The costume was all mirrors from head to tow. By far the heaviest costume I've ever worn. Not very mobile, but it made quite an affect under the lights on stage.


Here's a picture of me as one of the waiters in Rosenkavalier. Baron Ochs refers to them as Maikäfer, a type of bug that comes out in Spring, so the designers decided to have us painted up as bugs in very nice, linen servant outfits. They do some crazy stuff in the German speaking countries. I won't show you the picture of me as an "old servant" dressed in tight, white boxer briefs and a pink, silk ladies bathrobe with a choker around my neck!


The opera world is a strange and wondrous place.
I do recommend coming out to see any of the productions I'm involved with this summer, even if you've never been to the opera before. They're all good shows, and seeing opera up close is quite impressive. And for those worried about language, they will all have super-titles projected above the stage. I would recommend buying tickets very soon. Almost all of the performances for New Jersey Opera Theater sold out last year and I would expect them to do the same this year. And don't worry, there's not a bad seat in the house, so just buy whatever is available. Ideally, I'd recommend somewhere in the middle of the house and no closer than the first 3 or 4 rows. That way, there's a little room for the sound of the voices to come out and blend with that of the orchestra.

Sunday, April 8, 2007

Market Posture and a close eye on CTSH

Because I won't be able to attend the meeting this week, I thought I would take my stab at identifying the trends of the market. In our last meeting we did a market posture that I recounted on the blog here. The end result of a very measured walk through all the angles was a bearish stance. It kind of stinks to do all that work and see the market rally in the next week. But should our stance on the market change?

Remember that this exercise is done with an emphasis on choosing an intermediate term stance on the market. That means a time frame of the coming 1-6 months.
  • Long term, still bullish. Higher highs and higher lows.
  • Short term, still bullish. Higher highs and higher lows. New high made this past week for this shorter trend. When we looked at it at the meeting, the higher low we had was just barely a higher low. It is now unquestionably a bullish short term trend.
  • Intermediate term, I'd say we've changed from Neutral/Bearish to Neutral. We discussed that the former long uptrend of higher highs and higher lows was clearly broken. We appeared to have put in a lower high, but now that has been taken out and we're waiting to see if we put in a new lower high or if we power back up to and through the former high.
Look at these three views of the SPY, which I used for the reference of volume. It seems significant that though the recent high that we spoke about last week was broken this week, it was done with very low and decreasing volume before the holiday weekend.
(Click it for a bigger view)


The Market forecast shows the green intermediate term line heading up with room to go along with the longer term sentiment line having turned upward. These are bullish signs. This chart even shows that the 20 MA is headed upward toward the 50, which the index has reclaimed.


The VIX has moved lower to the bottom of its recent range, but I see it sitting right on support. My reading of it is that it would be more likely to bounce up from here than move down. This has a bearish implication, but until that happens and even if it does move lower, I will read this as Neutral. Here is a weekly chart.


Putting all this together, I would read the result of this market posture exercise as cautiously bullish. But because the intermediate trend of the SPX was broken and is now still is in question, I'm reluctant to fully embrace this rally. Though I may put on bullish trades, I will keep them on a short leash and I will continue to watch for bearish trades.

Back on January 28, I did a post suggesting potential for a sideways market. Perhaps it was a bit premature and wrong to think of some nice and orderly sideways market. But I may have also been on to something. Given the look of things now, it would not surprise me to see the market stuck in a range between 1375 and 1460 or 137.5 and 146 on the SPY. That's plenty of room for daily and weekly turbulence.

In a recent post I included a potential bearish setup on CTSH. (it's toward the end of that post) The support line hasn't broken yet, but after an attempted bounce the stock has now bounced down from the 30 MA. Thursday's candle was a dragon-fly doji star, much like hammer in its implications, though it has yet to be confirmed with a higher close. But, as always, the primary consideration is support and resistance. Watch for that support line to break on big volume.


Have a great week!

Wednesday, March 28, 2007

You missed it! Market Posture!

Or maybe you didn't and were there. In any case, we had a great meeting tonight! Lots of nitty gritty and educational discussion. Good crowd of regulars and contributing newcomers too. Thanks to all for your presence and participation. Special thanks to Margie for a great presentation on her 20/40 moving average crossover system. Indeed, it seems that keeping it simple is really smart, STUPID! (K.I.S.S. The bold printed STUPID is really directed at myself) :-)

As always, we started off with a (not so) quick jaunt through the market posture exercise to establish a relatively objective stance on the market. It seems to me like I should get through that process faster, but particularly at a time when the direction of the market is very much in question, we must never underestimate the importance of trading in the same direction as the rest of the market players.

In the intermediate time frame, the SPX is showing a lower high, but not yet a lower low. Therefore we have a Neutral/Bearish posture for that most important judgement. The short term, in contrast, shows higher highs and higher lows for a bullish trend. (see grid below for time frame definitions)
If the 1410 level doesn't hold as support, I don't see much stopping it from going quickly to 1380 in the near term. And if it makes it to 1380.....not good. That's the last holdout before an official lower low on the intermediate term picture. Or maybe it's fantastic for put buyers and short sellers, depending on how you look at it.
(Click on images to see them grow. It works the same way our accounts should when we click on the buy and sell buttons.)


I have added to the regular grid another 0ne to define the short, intermediate and long term trends based on higher highs and higher lows or lower highs and lower lows. With that, we can try to be as objective as possible. But our focus as active investors/traders is on the intermediate time frame. I have also taken Lauren's suggestion to keep a running record of what our posture was each time we do it, but I don't have anything saved from before last meeting.

Because the other two indicators, the Volatility index and the Investools Market Forecaster, were also judged bearish, we assumed an overall posture of bearish. But keep in mind that the Index itself is always the primary consideration. We look to the other two factors to confirm and support what we're seeing in the price action on the Index.

We judged the VIX bearish because it bounced off of the 12.50 area, the prior ceiling for the VIX and seemingly the new floor. The VIX may be range-bound now between 12.50 and the 20 area. But whether range bound or going higher, it is currently headed upward in that range and with more room to go to potential resistance than distance back down to new support at the 12.50 area. Because this is a contrary indicator, as this goes up, we call it bearish.


On the Market Forecaster, the green intermediate line has turned downward and put in a lower high. When it crosses the 50 line, that will give more weight to the bearish case. The much longer term market sentiment line in gold is also headed downward with plenty of room to go. Again, though the shorter term lines are low and show potential for a bounce, the emphasis is on the intermediate term which is now in sync with the longer term indicator. Notice also that the market rallied back up above the 50 MA, but quickly fell back below it.


In other news, we've slashed a lot of stocks from our list. The reasons why certain stocks were cut were: F/E score below 3.25, Estimates score markedly lower than the Financials score, trading volume too low, very poor performance relative to the industry group, overvaluation, sales and earnings growth and growth estimates lower than we'd like. We want trailing sales growth and earning growth of 25% or better and an estimated earnings growth for the coming 5 years to be 20% or better.

Here is what we have left on the list for the time being. Judging from the fundamentals alone, these are some beautiful looking stocks.


In the coming weeks, I'll put up some ideas to add to these and we'll settle upon a new list to watch for when the market does regain a bullish posture. Until then, be careful out there and consider looking for some bearish ideas to balance out whatever bullish positions you may be in still. Now is a time for stop orders to be in place.