Showing posts with label DJUSHB. Show all posts

Saturday, December 1, 2007

Market Posture for the Holidays. Feel the spirit!

I like going through the market posture on the weekends. Not so much because it's so different from a day or two before, but because you can look at the bigger picture using all complete weekly candles. Looking at this way tends to smooth out the noise of each individual day and somehow makes the process a bit easier and perhaps more objective.
Here is the Market Posture Grid as filled out at Thursday night's meeting.
(Click on image to see it bigger.)


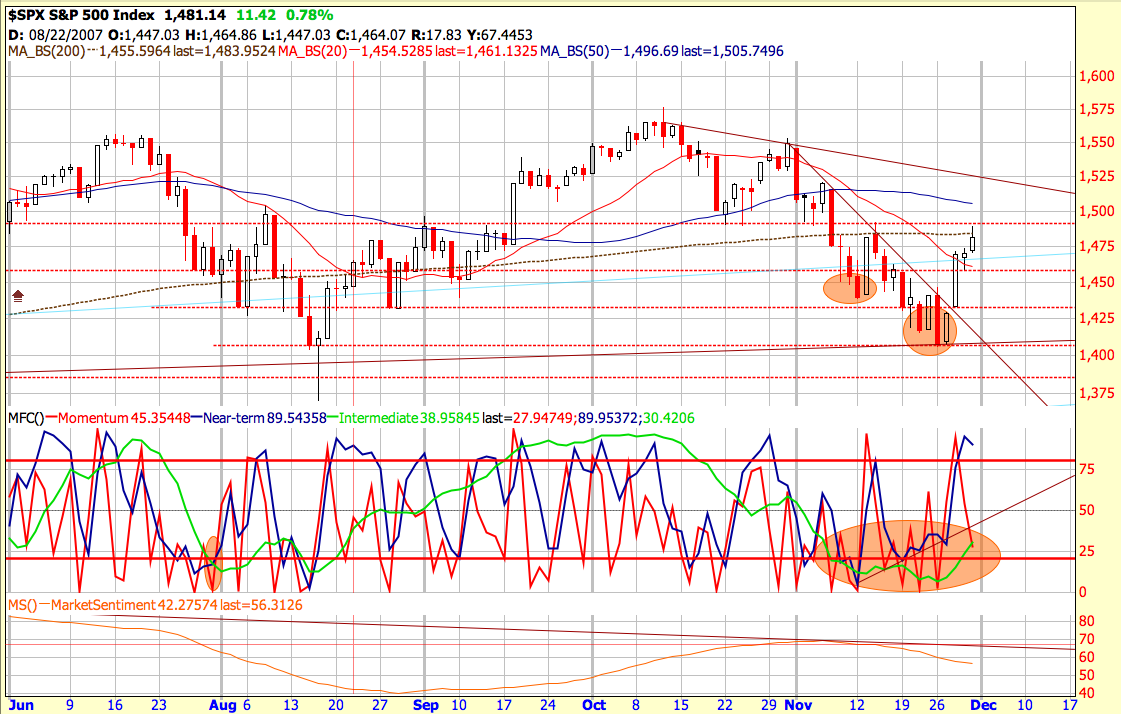
Below is the weekly chart for the SPX. It's hard not to notice that there is a very clearly formed double top formation in process. But like any pattern, it's just a potential pattern until it is complete which is when the support line is broken in this case. It's also very apparent that the higher high is less of an improvement than the previous higher highs. Same with the higher low, and on the daily chart it's more of an equal low. Nevertheless, the intermediate posture on the SPX is still arguably neutral due to no major lower low and still having no major lower high despite the clearly bearish short term trend. What further supports an at least neutral intermediate posture and potentially bullish short term posture is what looks like a possible short term reversal at significant support. This week's candle is clearly bullish(engulfing and then some).
Thursday night we spoke about potential points of resistance to look for in this market rally. Having been a very significant point of support and resistance many times in the last five months, 1490 seems the most obvious level. Interesting to see the rally peaked out just a dollar short of there intra-day on Friday.


The weekly VIX chart also shows some reason to be bullish at least for the time being. The long term trend in the VIX is clearly up and this is a long term bearish indication, but remember that it is the intermediate and to some extent short term that we should be most aware of, as the "long term" shows us what has happened somewhat long into the past. The Intermediate and short term will give us a better idea of what to expect for the immediate future.
On an intermediate time frame, we have a lower high even if just slightly, and a lower low from mid August to late September. Looking a the bearish reversal candles in beginning November, we see that they have been confirmed in the past week's lower close. Furthermore, this week, we got the important piece of the puzzle we were waiting for which was a lower low on the short term VIX, a movement below daily support(and former resistance) just below 24.


For the final component of the Market Posture routine as taught by Investools, the Market forecast is giving us a clear bullish reading on the intermediate term with the green intermediate line having moved upward out of the lower reversal zone.
There is also seen one of the major "signals" that the Market Forecast indicators give which is the "Near Term Divergence." This is where the blue Near Term line puts in a higher low while the SPX itself makes a lower low(opposite for a bearish divergence). As with any signal, it doesn't tell the future or work out every time, but in this case it has worked out at least short term.


It's hard not to feel the fear in the air and even to notice that the SPX is still under the 200 MA even with the rally of the past week. I'll let you do the process with the Nasdaq, but it's interesting to note that doing the three pronged posture in as objective a way as we could, we came up with a Bullish posture for the Nasaq and Neutral for the SPX and only then looked to note that the SPX is below the 200 MA and the Nasdaq is above it. Perhaps it is not earth shattering news, but noteworthy nonetheless.
There are certainly lots of things to be worried about with the economy and even the charts. But there are also potentially positive factors for the market, so who knows?
I won't list the negatives, but as for a few potential positives from one who is FAR from an economics guy, how about oil prices finding a potential top?

How about the weekly bearish engulfing on the Yen at long term resistance? It may be short lived, but it looks like it needs to come back in a bit before moving higher if that's going to happen.

How about the plunge in the US Dollar coming to a halt at least for a while as is shown possible by the bullish engulfing candle on the weekly chart? It's awfully far from the 40 week MA.


This may be grasping at straws, or however that saying goes, but the home builders have just been relentlessly hammered for a long time. Even if the outlook is still far from rosy for them, an end to the plunge is inevitable at some point. We know that all homebuilding in the US will not come to a complete stop and therefore the homebuilders will not go to zero. (All you gloom and doomers, yes the apocalypse is the exception.) Though far from a convincing bounce just yet, we do have a bullish engulfing at an old support level and even bullish divergences on both the MACD lines and the MACD histogram. I can't remember who, but I believe someone from the big name investors out there announced taking a major position in one of the homebuilders this week.


For an even more thorough feel of what "The Market" is doing, I encourage you to build a watchlist of the Sector Spiders. 9 ETFs that as a general snapshot show you the action of the market in 9 clumps of related stock groups. There are many ways to look at the sectors of the market and the "sectors" seem to be defined differently by all, but this seems about as quick and easy as any. Notice that the XLF put in a monster bullish engulfing on the weekly chart with its highest weekly volume to date.

I do realize that my showing only the positives and not the negatives seems an awful lot like being a bullish cheerleader. But really, I just want to focus on the positive a bit, because all we've heard about lately is the negative.

There is, without a doubt, downward pressure on the SPX and tough resistance at 1490 even with this week's rally. I will look to 1430 (support from the inverted head and shoulders in August) for a potential level of support. Just about all of the above will probably be null and void with a decisive break below 1406. With a real break below 1375.......Look out below.

Tuesday, January 16, 2007

Sector run down

I'll use weekly charts here to run down some of the majors. Peter Reznicek, the shadow trader guy, mentioned recently in a video or in his daily show that candlestick patterns are much more powerful or reliable on bigger time frames. We've all seen plenty of daily hammers or bearish engulfings or whatever that were just steam rolled. While we have to always remember that they are merely another form of an indicator and therefore secondary to trend and support and resistance, it's very useful to size up weekly action with candles as they are stronger reads. This makes a lot of sense to me.
As I pointed out in the last post, Oil is moving down in a serious way and is more likely to continue a bit further than move meaningfully upward. The Oil index is actually still in a healthy uptrend the higher highs have been slightly less aggressive lately, but higher all the same. This week shows a potential hammer indicating a potential reversal. To play an ETF on this sector look to the XLE, one of the heaviest traded of ETFs.
(Click image to see it grow)


The oil services don't look quite so healthy. Long term trendline was breached months ago, but this is a clear break. You might also even call this something like a Head and Shoulders top, but it's not so clear. Tough to figure exactly where to place a neckline for a support break. Regardless, if you're looking for a bearish play on oil look to this sector or just play the OIH ETF.


The convergence of price swings in gold seems likely to bust out in one direction or another and from what I understand about the dollar, I'd think up would be more likely than down.

Gold stocks have formed a sideways channel for the latter part of 06. Intermediate down trend in place now, but there is likely support at 125. For a pure play on gold, look to GLD. For the gold stocks, GDX.


Biotech looks very impressive with a break above it's bull flag resistance. For Biotech ETFs, look at BBH and IBB, but check out their composition. Quite different. BBH is heavy in DNA. DNA had an big breakout above a channel of months sideways of sideways movement.


Broker Dealers are making even more money. Everybody loves the stock market right now.
Big bullish candle on a break above resistance to a new high. What's not to like? Not sure if there's a perfect tracking ETF, but XLF is close. Take a look at GS and LEH. Amazing stocks with ever new highs.

Transports seem to be making an effort, but the chart still has quite a bit of work to do to look attractive. Look to IYT to play this index.

The recovery in the homebuilders still looks healthy. That may change soon, but so far, so good. The chart is showing a potential hammer at the seemingly significant 700 level. I'm showing a much bigger time frame here to show the huge topping formation that looks like a pretty well defined head and shoulders pattern. It's height of about 250 pts. forecasted the downward move of around that distance that actually happened quite dramatically on the break of the neckline. XHB is the ETF to play this group with.

The Internet stocks are a touch worrisome in that they didn't have a strong week while the Nasdaq was super strong. But it has been a very strong rally from the inverted head and shoulder reversal pattern, so a bit of consolidation after it exceeded its projected target makes sense. In the last five weeks we have a seen a bearish engulfing pattern, a tombstone doji and two spinning tops. What does this mean? Nothing. We're moving sideways between support and resistance. Watch those two levels for the next move.

After almost two years of sideways action, Software has moved into higher territory and to my eye had a little pennant formation formed. This is a bullish continuation pattern and looks to have begun the next move higher this past week. 3 more points beyond 190 and we'll know for sure. You know what Software stock has been very strong in the last year?
ININ. - GRRRRRRRRR!!!!!!


The strength in the Nasdaq just wouldn't seem complete without some confirmation in the Semiconductors. The SOX index does seem to be working on breaking the long term down trending resistance line, but it won't feel like the job is truly done until 490 is successfully surmounted. SMH is the ETF to play on this group.


Banks ascending steadily in 2006, but looking at the two year period, it looks like an ascending wedge which is inclined to break do the downside. With the bearish engulfing of a shooting star in recent weeks, I'd expect some kind of pullback. For now, however, we've got support at 115 with a big bullish candle that broke above that level. A bounce there would be the most likely for the immediate short term.


Healthcare stocks have been very strong in the latter part of 2006. Starting off 2007 with a big bullish candle too. I have to play devil's advocate, though and draw in th same type of resistance line as on the previous chart. The difference is, this chart looks very likely to blow right through this wedge. It probably needs some healthy consolidation for much more meaningful gains, but it looks like it wants to keep going for now.


There's screwy data on this chart for Healthcare stocks, so it's tough to get up close with it. Generally a nice looking ascent over the last 3 to 4 years. Some minor topping action, though, at resistance for this very long term wedge. It's been very strong since July.
TWGP was one we talked about in a meeting months ago. It had a beautiful trend, but has since broken it and begun a intermediate down trend.


After a few months of consolidation, Retailers reported much stronger sales than expected in December and pushed the index above resistance into open territory. The argument is being made that the strong consumer showing will support the economy for a bullish year ahead. I wonder what percentage of the consumers out there are buying on credit? For a very strong chart, look at MA, Mastercard. With some nice volume pushing through resistance here, it's a buy.
To play the retailers, look at RTH.


So there's the broad stroked look at it. I hope you agree that looking at weekly charts can really simplify things. Of these charts, there are 7 either at or near all times highs. I'd say that's a very bullish sign for the market.
From here you can choose the sector you like best and drill down further for stocks ripe for the picking. There are plenty of sweet ones.
Happy Hunting