Showing posts with label ISE. Show all posts

Wednesday, January 31, 2007

FED relief

The FOMC released their statement today at 2:15 PM and decided to keep the target fed funds rate at 5.25%. It seemed a foregone conclusion that they would not cut rates, but judging from the action in the markets starting at 2:15, I'm thinking what people needed to hear was that there wouldn't be a rate hike. Even if slower, the economy is still growing and the bulls seem to want to run further. Look at today's chart with 15 minute candles for the SPX, Nasdaq composite, Dow Jones Indusrials (Thinkorswim doesn't support the ticker for the dow, so the DJX is the same thing at 1/10 the size) and the Russell 2000 small cap index. The red line is drawn before the 2:15 candle.
(click image to see it bigger)


Look at the total volume New York Stock Exchange for the past 4 days broken down into 15 minute chunks. The cross hairs on each day show the level right before the 2:15 period began. Today's trading increased significantly as the market pushed rapidly higher in the last hour and forty five minutes of trading. Perhaps that seems like a silly and obvious observation to make, but it is a good piece of confirmation for the upside sentiment.
(I still can't figure out why this Total volume chart doesn't' show the same numbers we see for total volume on the NYSE home page or Yahoo. Nevertheless, it gives a good relative picture.)

Though the Nasdaq and especially the SOX still look somewhat questionable in their technical strength, the Dow is back working on a new high and the SPX has jumped back above the 1431 resistance line I've shown on recent posts. So it seems the breakout may get another chance.
But most of all, I like the look of the Russell 2000 moving above it's relatively orderly period of sideways consolidation. This would indicate that small caps would be good stocks to look for buys, or you could just play the IWM, Russell 2000 ETF. Remember that even if you're wrong about a bullish stance, it's best to get in near support so you know where to get out for a small loss. It did come in more than the other indexes off the high of the day, but strength tomorrow could be a great entry. I would look to 79 for new support and aim for a target of 81 judging from the height of the sideways channel.


Notice that the FOMC statement mentioned tentative signs of stabilization in the housing market. The housing stocks have been rising steadily since September and were up nicely today even before the statement and more so after. Our KBH is looking well on its way. 55 may yet be a point of resistance in the short term, but 60 seems like an inevitable destination.


I'm kicking myself over ISE, which I discussed briefly in the last post. If had stuck to my original plan to give it room up 'til 47.50, I'd be feeling very good right now. I guess this is one nof the major realities of options trading. The massive swings in option price can really bring out the emotions. This is why we have to examine what we as individuals are comfortable with. Mine was a good analysis and the exit was not such a horrible decision either based on what I was seeing. But the added pressure of time decay and the leverage of the option are more what weighed on my decision, emotionally, than my certainty that it was going to go upward, the wrong direction.
I don't know what happened today, as there's no major news, but the stock is down on big volume. The ideal bearish entry to make here would have been on the first lower high after second of equal highs. That also was a bouncing down off the MA and had 3 red arrows. Would have been much easier to sit through the turbulence during which I bailed out. Double GRRRRRR!
That this stock had such a down day with no obvious news when the market rallied strongly does not say good things for it at all.


Happy Hunting. If the market is going to start a another leg up, this is the place to be looking for entries. The VIX, by the way, feel lower again today for a definitive lower high.

Monday, January 29, 2007

Handbags, anyone? - COH, Knee implants? - ZMH

Looking through our list, COH appears to be the most buyable at the moment.
The Industry group is looking good in the green on the big chart. The group chart is pulling back a bit after a very strong move since July. In the last six months, COH has considerably outperformed its group.
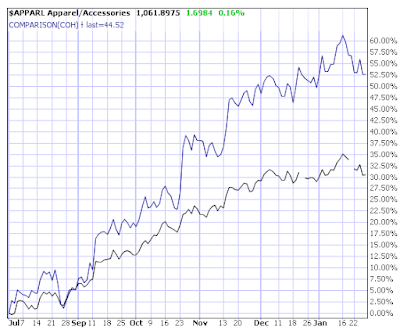
If the market and this group continues with strength, it would be a good bet that this stock would remain a leader. They just came out with earnings beating estimates for the 5th straight quarter.
The fundamentals are looking very strong here. The 5 year annual growth estimate at 20% is a touch lower than we'd like, but the ROE(Return on Equity) of 40 is very favorable. The brief run down from the press on the earnings announcement looks pretty nice. Sales in Japan grew 17%, (I assume that's year over year) and they're adding 10 new stores in Japan for a total of 20 new stores in 2007. Using the estimate for annual earnings in the fiscal year 2007, it now has a PEG of 1.24, which is still pretty attractive for a leading stock.
The day of the earnings announcement there was some odd intraday action, but it formed a Dragon Fly Doji, much like a hammer, that was confirmed with a bullish engulfing candle the next day. This coincides with the MA acting as support as it did twice in December. While the trend has clearly flattened out a bit, an entry here would put us closer to support levels where we might choose to use for exit points to the down side. Considering the potential sideways action, one might be inclined to wait for a close above the 45 area, which has been a minor point of resistance lately.


So what do we do with this, particularly considering the market is looking a bit ify right now? Buying the stock here would be pretty reasonable since it is so near support. Even with the uncertainty in the market, a tight stop under 43.50 or 43 would be reasonable with a plan to use one of those two support lines as an exit. But where's the target? Obviously a near term target of the recent high at about 46 or 47 would be reasonable. And looking back at the average distance above the MA in the last two years, I'd say somewhere between 3-4 pts. With the MA now at about 44, I'd say 37 would be a reasonable near term target. But for a longer term trend ride, I can't see why at least a nice, round number like 50 shouldn't be in the cards. So to play it as a regular stock buy, you'd have to decide if you're comfortable with the risk/reward and whether or not you'd want to look for a quick profit or to let it ride for a longer term trend play.

But let's consider some ideas using options. There doesn't quite seem to be enough juice in the options chain to make a covered call buy-write very attractive. Look at how the IV dropped very quickly after the earnings announcement. You may remember my mention back in December that this could be a good stock to play a run up into earnings and the accompanying rising implied volatility.
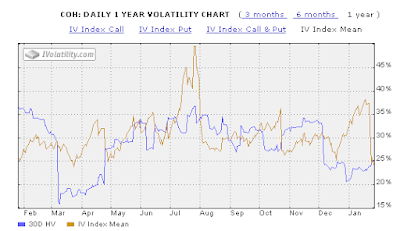
Buying the stock now and selling the March 45 call for 1.50 would bring a profit, if called out, of under 5%. Depending on how close you'll choose a support level to use as an exit, that might not be the most attractive risk/reward. What would make it more attractive would be buying a deep ITM call instead of the stock itself.


Buying the May 32.5 for 12.80 and selling the Mar 45 for 1.50 would technically be a "Diagonal" spread with options from different months with different strike prices. But used this way, it is essentially like a covered call. This position would cost $11.30 and bring a potential profit of 1.20 or 10.6% return on investment. The real question is whether that profit is worth what we'd be risking if we sold on a break of support. I think it's pretty debatable. But don't forget about the possibility of selling the following month after March expires if we're still somewhere under 45. What I'd be more inclined to do along these lines would be to buy the May 32.5 and wait until the stock moves a bit higher to "leg in" to a covered call, selling maybe the 47.5 or even the 45 for a higher premium.
Looking at the potential with vertical spreads, hedged positions buying and selling different strike prices but in the same month, the bull-put credit spread doesn't have enough premium in it to make it worthwhile, even further out in March. Using the support levels we have beneath us, it'd be nice to sell the 42.50 strike price, but a 42.50/37.50 March put spread would only bring in .60 for a potential return of 13% on the money at risk.
But what if we looked at doing a vertical spread with directional bias. We can do virtually the same spread with either puts or calls, buying the 40 strike price and selling the 45.

Here is the options chain for these 5 pt. vertical spreads. Because they are 5 pts. wide, the most one can ever make or lose is 5 pts. minus the credit or debit of the spread you opened.
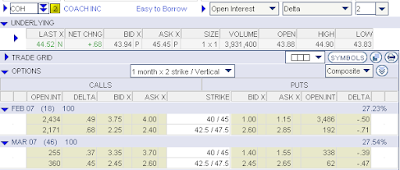
Looking at the Feb spreads, buying the 40 call and selling the 45 call will cost $4 with a potential profit of $1. If we use 42.50 as a trigger to get out of the trade all together, the loss would be about $1.50 because we know that the 40 call will have at least 2.50 of intrinsic value in it. Depending on how close it is to expiration, there might still be enough time value in the combined position to make the loss less than that. Of course, you could use 43 as the trigger to get out or even 43.50. But giving it room to move with a trigger at 42.50, we're risking about 1.50 to make 1. That's not bad at all considering the high probability of the win. The stock only needs to move up .50 in the next 18 days to get full profit. Notice that the same position in puts, the Feb 40/45 put spread, selling the 45 put and buying the 40 put will bring in a credit of $1, exactly the same.
If we want to be a touch more conservative we could give it more time. Using a March spread will both give us more time for the stock to go where we want it and will get us a better profit potential(and smaller potential risk) because there is more time value(fluff) built into the options we would be selling.

Buying the March 40/45 call spread costs 3.70, leaving a potential profit of 1.30, the balance of the 5 pt. spread. But selling the March 40/45 put spread would bring a credit of 1.40, a better potential return on the money at risk.

Investools seems to teach credit spreads as something to be used only selling the short strike price out of the money and behind support of some kind. But notice here that the credit spread that is actually a bit in the money here is more attractive than the debit spread. Also, one of the benefits of the credit spread(though very dicey) is that you can "reverse" the trade.
For example, with the March put spread, we'd be buying the 40 and selling the 45. If the stock suddenly broke through support in a dramatic way and with volume, we might expect it to go much further. We would then have a few choices: We could close the whole position for a loss. Or we could buy back the 45 put for a loss and let the 40 put pick up value as the stock continues to fall. If it goes far enough, the profit from the 40 put will compensate for the loss taken on the 45 and we might even end up with a net profit on a trade that went the wrong direction.
I want to emphasize that this type of trade reversing is very tricky and has further risk involved, but it's something we should understand as a possibility going into a trade. I'll do a post soon about a trade reversal I made on BHI. It was a successful fix, but more often than not I've screwed things up worse when I've tried that.
In conclusion, it seems to me that this is a tough options chain to deal with because there's not a lot of fluffy premium to sell. I would probably be more inclined to buy the stock or a deeper ITM call and look to leg into a covered call or diagonal spread. Or doing the March 40/45 bull-put credit spread(slightly in the money) for a potential 38% return on risk if the stock moves up .48 by March expiration.

I hope that all wasn't too confusing. There have been very comments/questions left on this blog. If any of this is confusing or brings up questions or thoughts to share, please do not hesitate to write them in the comments section below.

In other news, ZMH reported solid, estimate beating earnings today after the close and raised the outlook for 2007. Strangely, before the announcement, the market had already begun a strong bounce off the MA and trendline support for a break above resistance on volume well above average. Perhaps people are really interested in this one. Industry group is in the red on the big chart, though the group's chart looks quite strong still.
The F/E score is just at 3.25 our minum with the Estimates score at 2.75. Not quite the forward looking strength we'd like to see. Can you account for why the Estimate score is that low? I can. How to figure out the scoring is in your manuals.


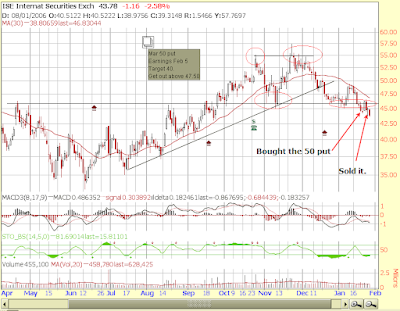
Our old friend ISE appears to be following through with the double top pattern, if a bit sheepishly. I'm pretty sure I've mentioned this pattern on this stock a few times already. Earnings come out Feb. 5, so use caution before then.
Notice the little note I put on the chart. On 1/22 I bought a March 50 put. Looking at the chart action, I chose 47.50(around where the MA was) as a bail out point but got out early because the candles seemed to be telling me that support at 45 was going to hold. I closed it 1/26 for a small loss after seeing a morning star formation at support and then a Hammer on the day I closed it. Perhaps I should have waited for confirmation on the hammer with a close higher. That didn't happen. It went lower and I would be profitable right now. Grrrrrrr!

Lots of important economic announcements this week, especially the FOMC meeting statement on Wednesday. So be careful out there.

Sunday, January 21, 2007

ICEy Hot

(No this isn't a commercial for the Ben-Gay alternative. It's about our first change to the list.)

I hope everyone has had a good weekend. Are we getting our heads on straight for the coming week? It is a tough time to know what to do in the markets at the moment. In addition to the commencement of the unpredictable earnings season, we seem to be getting quite a dose of mixed signals between the SPX and Dow holding up nicely(even if at resistance) with potential support from the Transports, while the Nasdaq took back most of the promising strength it showed two weeks ago. Much worse is the SOX index at a two month low and in an intermediate term downtrend. It may find support on the backside of the old downtrending resistance line, but if it takes out the 445/450 area in a meaningful way, that will be a very bad sign.
(Click it)


Let me again urge you to watch Peter Reznicek's weekly ShadowTrader video. You can find it in the center column at redoption.com.
I also encourage you to visit the home page for BigTrends.com. There you will find four regular columns for which you can read through the archives. Their Weekly Outlook is always worth reading, if a bit heavy in indicator talk. I received my free membership email today for their Daily Trend Watch which focuses on different subjects from day today. The one I received is not yet posted on their site, but will surely be there by tomorrow, Monday. It is a good discussion of earnings expectations and reactions. Meanwhile, the most current topic is Using the Right Tools at the Right Time. In it they explore the application of different indicators in different environments including a focus on the MACD and Stochastic like we use with the Investools set. The application of the teaching in that article to today's environment might be that we could start looking a little more strongly at the Stochastic as our strong trend seems to be flattening out and we're looking more range-bound.
I know that it is very frustrating that there's always something new to consider which may refute our technical indicators and whatever combination we may use for buy/sell signals. But when it comes down to it, there is not "right" or "wrong" set of indicators or signals. The undisputed common denominator between any and all successful traders can no doubt be that they have rules with regard to money management, position sizing and controlling risk for the times that they are wrong.
We've talked about a trading plan and rules lately. I myself have wrestled with this one and get the sense that many of the members of our group are doing without them. I would agree that it is very difficult for a new trader to establish a plan or approach they're comfortable with, particularly with little knowledge of the market, much less which strategies they like. But there is no question that everyone, especially the new trader, should have rules for handling their money and managing the risk in any trade. PLEASE! If you have no other rules for the time being, at the very least, make rules regarding money management and position sizing.
On the Investools site now there is a section on the top right corner of the Online Home page that shows a scrolling, clickable list of the 10 mistakes new investors should avoid. There is a reason we hear these same tidbits over and over. Make the effort to put something in place.
The challenge will not only be to put some kind of rules in place, but even more so, to follow them.
I bought a LEAP many months ago on JLG. I won't go into the details of the trade, but since I had so much time in the option and the company had such strong fundamentals, I ignored the clear technical breaking down of the stock and watched the option lose all of its value. ALL of it. My rules told me clearly to get out of it, but I didn't follow them. So now I have been looking at this worthless option in my portfolio for months as a reminder. Thank God it finally expired!
Here is another good article from IBD which discusses cutting losses short and letting winners run. Investing Success Doesn't Require Perfection.

OKAY. Enough of that. I have mentioned wanting to reshape our list a bit. Starting most obviously with the stocks that no longer match up to the Investools recommended minimum number of an F/E of 3.25, ISE is one that is looking pretty weak. Though still clinging to a 3.25, the forward looking Estimates score of 3 is the weaker of the two and we would rather see that score be the higher of the two. But more than anything, it is the chart that is most unappealing, particularly in the face of great strength of its group.


Even through the dialy look at the chart with the Investools study set, it doesn't look good at all. Three red arrows with the stock bounding down off a declining MA and it is once again pushing the pivotal support level which, if broken, would confirm the double top pattern. If it does break 45, this would call for a move down to 35. I must say, though, that I am a touch hesitant to cut this one loose because there are positive things to see here.
At the last earnings announcement, the stock gapped up strongly with high volume. Though it did immediately pullback almost 20%, the rally into the second top shows quite higher volume than the sell-offs surrounding it. With earnings coming out again on Feb. 5, that could be the catalyst for the next leg up. So continue to keep an eye on this one at home.

Just to give some perspective of what the industry group is doing, check out this index.


In the meeting last week we walked through the process to find a replacement for ISE and agreed that ICE was a good choice. Remember, in searching for something to represent this group, I want to keep dealing with stocks scoring 3.25 or higher and trading somewhere around 1 millions shares a day or higher for purposes of liquidity, a tight options chain, and more reliable technical analysis.
Look at this comparison of relative performance among top scoring and top performing stocks in this group over the past 3 months as the XBD index put in two new higher highs. ISE underperformed the pack while ICE has clearly outperformed by a mile.

I should mention that for the year ICE is up about 150%, by far the biggest gainer of the bunch. Here is the weekly chart of ICE since it's IPO in late '05.

Looking at the daily chart with the Investools set, it looks like we're pulling back a bit to digest some of these major gains. We want to be very careful to not be the last people to arrive at the party and leave unhappily. I would look for support right around 115 at the MA and the potential horizontal support from the old high. If that is broken, it would be a likely end to the long term trend, for a while at least.
What I find really interesting is that this last leg of the upward push comes after a relatively uneventful earnings announcement that was followed by a couple down days.


We looked at the F/E scores at the meeting and found them to be to our liking. The one shocker was the PEG of around 5, WAY higher than the ceiling of 2 we're looking out for. But Jim helped me realize that this was using the trailing P/E with earnings on the past year. Looking at the Earnings of the current year 2007 we find that Price(126.91)/2007 Earnings eastimes(3.36)=P/E(37.77). So we divide that by 5 year annual growth estimate of 24% and we get a much more digestible PEG of 1.57.
The P/E of 38 is still at premium to the group(23), but that is the price for being in a leading stock.
This stock has its next earnings announcement on Feb. 06, the day after ISE. I sure hope I don't wind up with egg on my face to see ISE take off and ICE fumble. ;-)

Saturday, January 6, 2007

Some Trades

I know I said I'd do a look at some of the sector indexes, but with an erratic and short first week of 2007 behind us, I'd rather wait until we have another full week under our belt to get a more settled look at what's doing in the market. In the meantime, the first three days of trading in 2007 were quite jumpy and on considerably higher volume than the holiday period. We talked about the relative weakness in the Nasdaq and particularly the Nasdaq 100. Yet those indexes actually gained on the week, the NDX(Nasdaq 100) getting back above the broken support line....

...while the SPX and Dow both were down. What is most striking to me is that the SPX closed right at the horizontal and diagonal support lines that I've had drawn on my chart since the prior week. It's just weird when that happens. If this 1410 area is broken, this will be bad news for the short term. We already have lower highs and lower lows on an intraday basis, but on a closing basis, this would be a clear lower low. After 1410, I would see the 1380 area as very important support for the intermediate time frame.
(click for bigger picture)

All this is to say that the markets are still giving us pretty mixed signals and though we may be on the verge of something significant, we haven't broken yet. A crucial thing to watch will be the VIX index. "When the Vix is low and starts to turn up, it's time to go." The weekly action on the VIX shows a doji star with a fairly wide range but small body. It closed up somewhat for the week, but still hasn't broken above the very significant level just under 13. If that is broken while the SPX breaks 1410, I would see this as a blatant signal to turn bearish, at least in the short term.


This article is an interesting look at the sell-off in commodities as a signal for economic slow down. The basics of it make sense and its nice when big talk on the economy makes sense to the average civilian like me. Also, it's worth mentioning that the Wall Street Journal pointed out this morning that we haven't seen healthy correction (10% pull back in a bull market to keep it from overheating) in the Dow or SPX in several years.

One member mentioned at the meeting that we spent a little too much time on the market posture rather than looking at individual stocks. It's a reasonable comment. Of course, what matters most is what is going on with the individual stocks that we have our money in or want to put our money in. But it is crucial to always stay in tune with the broad market indexes because when they are at potential turning points, if they do turn, each individual stock will drastically change its tune even if it has been performing very well. Strong stocks on the verge of breakouts and further advance will, at the very least, wait longer to make their move. At worst, they'll see profit taking as people want to reduce their risk. I try to think of the market as a bunch of people standing in a room watching what each other is doing. When the selling gets going, most people will join in and follow the crowd. Look at the run up and sell off in GROW. I think it's fair to say that this was all the momentum of people piling on to the buy side of a super hot stock and then all bailing out as the momentum swung back to correct the move.


Here are a few trades I've done recently on our list.

COH December bull call spread. Purchased on October 30 for 3.80 with the stock at 40.08.
This chart from that day shows my analysis and entrance was made on the most current daily candle of this chart. The mention of short sellers is because I'd seen that short interest had decreased over those months.
(Click image to see it bigger)

I rarely do a debit spread but am realizing their appeal more and more. Credit spreads, of course, have great appeal, but they serve different situations. I did this one because a credit spread only makes sense to me if there is a support level between the short strike and the price at the time. In this case, I did the bull call spread because I saw a potential pull back to one of two support levels between 35 and 40. If it would pull back enough to make it worthwhile, I planned on buying back the 40 call for a profit and then hold the 35 call for the expected bounce back up. That's also why I bought the December spread, to give myself a bit more time in the long call if I went that route. It ended up not pulling back very much and I never bought back the 40. Of course, when the stock started moving, I wished I wasn't in a capped profit position, but I was happy to just let time decay for the position as long as it stayed above 40.

On 12/4, I sold the position for 4.85 because I realized that even the max profit on the 1 contract spread would not justify the commissions for exercising the options. It was more profitable to take slightly less than the max potential profit and pay only the small commission for closing the position. I could have waited a couple weeks longer and maybe gotten .05 more, but I was happy to just close it and move on. (Think about it. What market maker is going to by a $5 spread from me for $4.95 for a profit potential of .05?) In the end, I made $.99 or a 26% return on $3.80 investment including commissions on a stock that didn't have to do anything but go sideways or up from where I initiated the position.

I mentioned in this post a BHI bull put spread I placed. I'll follow up on this one in coming days, since I reversed it and went through the whole dicey process of trying save a bad trade. This will take a whole post in itself, so I'll leave it out for now.

On the second post of this blog, I did a detailed analysis of ZMH and proposed a trade on it. Two days later, I opened a paper trade.
On 12/7 in the 11 o'clock hour at 75.03, I bought a Jan 70/75 bull call spread with a fill at $3.58. Again, I did a bull call instead of a bull put credit spread because I saw the possibility of a slight pullback and prefer credit spreads when there is clear support between the price and the short strike. But with my analysis of the stock and the healthy trend, I was comfortable to get in, let time(theta) decay, and trust that it would close above 75 at Jan expiration. A break of the uptrend support line would have been a good place to exit for a minimal loss. I say minimal because as the 70 call would lose value, so would the 75 call, offsetting each other to a good degree. But let's say the trend line was broken and we got out of the position with the stock at 73. The position as a whole would still have had $3 intrinsic value and time value on top of that. So I think it would be a minimal loss, definitely no more than .58.


I sold the spread on January 3 when the market was selling like crazy and this stock showed a severe looking bearish engulfing pattern. Even at the time, I realized that it had not yet broken the uptrend support line, but I didn't like the smell of the market and didn't want to risk giving up any more profits than I had to. I was happy to close it for a decent gain. 23% return on investment not including commissions.

Last month I mentioned a potential bull put spread on ISE in this post with accompanying chart on a bounce off the trend support line. I paper traded this Jan 45/50 bull put spread entering the next day, 12/18 at noon for a credit of $1.65 with the stock at 49.78. This is a bit unusual for me, since the short strike was in the money, but with the trend line so close I knew it'd be either up above 50 or would break the support line in a very short order. Therefore this issue should be resolved fairly quickly. I failed to see the high volume selloff before the bounce as a warning signal. Or maybe I did and that's why I only paper traded it. I'm generally less on top of my paper trades than real trades and didn't close this for a couple days after the support was broken. In any case, with a debit of 2.85 to close, the loss was $1.20. The positions was sized for the max loss potential of $3.35, so this was well below my maximum acceptable loss.


One of the difficult realities of spread trading is that they have a much higher probability of success, but a much lower profit potential. So one must understand and strike a balance between these two aspects in order to be profitable in the end of a number of spread trades.

For those of you still new to the market and trading, I strongly recommend sticking to getting a strong grasp of basic fundamental and technical analysis of stocks and learning how to plan and manage simple directional stock trades first. If you don't know what you're doing with basic stock analysis, you definitely won't have a clue how to deal with the stock's movement affecting a more complicated spread trade.

Another paper trade still in progress is a regular stock purchase on VPRT, a stock I've mentioned at a meeting or two. Bought on 12/11 a 32.52, I was anticipating the formation of a handle to complete a cup and handle pattern before the stock powers through the official buy point above the highest point on the right side of the up. That is where there would be no more "overhead supply" or sellers. So let me be clear that this was not yet an official buy according to the O'neil teaching on cup and handles. But if it does clear the buy point, the target would be roughly 47.50, using the depth of the cup as a target distance from the buy point.

But aside from the potential cup and handle pattern, it was in an intermediate term uptrend and bounced off of old resistance, confirming new support. My stop was set just below the round number of 30 at 29.95 and the position was sized for that distance. The support was breached, but not in a convincing way to me with volume decreasing on the selloff and I thought the intermediate trend line, the potential pattern, and the well received earnings report in October deserved the benefit of the doubt. Notice the big volume selling day on the 15th has a good sized lower shadow indicating buying pressure as a significant part of that volume.

As of right now, the intermediate trend is still in tact and I will get out on a convincing break of the uptrending support line, particularly if the broader market continues to look weaker. It is worth noting that it is perhaps expensive here with a PEG of around 2.

That's all for now. I'll try to get that BHI trade a maybe a few others up in the near future. I the meantime, please leave any questions or thoughts about what I've written here in the comments section just below. Hope you're enjoying the beautiful day today.

Thursday, December 28, 2006

F$#%&@& ININ, spread orders, Technical Analysis

Double Sigh. (See earlier ININ post "Whipsawed" for the first one)

With two confirmed candle patterns testing the new support, the bull flag was broken yesterday for a very good entry signal. Apparently the rest of the world saw that too. But I didn't trade it.
Another case for the lesson about watching a stock deliberately and taking the signals that are there, even if you got stopped out for a loss already. In fairness, I have been hesitant to take on aggressive positions in this holiday time when the volume in the market is so low, but there sure was nice volume here on this one. Granted, the stock has almost doubled in under 3 months. But with all that volume backing it up, who are we to say that it's tired?
(Click on the picture to make it grow.)


In hindsight, I realize that my mistake was setting a stop loss order too tight for a volatile stock like this. I assumed the old resistance would provide new support when I should have sized for a stop under the old support and kept a mental stop below the new expected support to allow for intraday noise like we saw on the big hammer day. 3% below support is different on a stock like this than on a steadier big cap stock. To see the other posts with the story of this ININ play, click on the ININ link at the bottom of this post.

After my post yesterday, I watched BHI for the Harami pattern to be confirmed with an up day. It was looking stronger earlier in the day, but even with some selling toward the end of day, it was still an up day. Because of my distrust for the market at the moment, I decided to play it a bit more conservative and do a bull put spread. This way, it doesn't have to make the big potential move I see. All it has to do is close above 75 at Jan expiration. Jan 70/75 bull put spread. I actually placed it in two accounts.

Let's talk limit orders and negotiating. With options and especially spread trades, we very rarely want to place an order at the natural bid or ask. There is usually room to negotiate.
The spread was 1.25 at the bid, 1.45 at the ask. I placed the orders for each account for a limit of $1.35 at 3:07 PM. They sat there. I decided to negotiate a bit. I moved one of them to a limit of 1.33. It sat. Seconds before 3:15 I moved the limit to 1.30 and it filled in exactly one second while the stock was at 75.57. I let the other order for 1.35 sit. At 3:29, 22 minutes after it was placed, the order filled for $1.35 when the stock was at 75.48.
To my knowledge, the bid/ask on the spread did not change in that whole time as the stock moved in a relatively tight range. Whether it was the difference of .09 in the stock price or just antsy market makers, I got the fill I wanted by waiting and still did better than the natural bid on the order that I did bring down my ask.
The moral of the story is that we must not forget that this is a market place and therefore a place for negotiating our price. Sometimes we have very little room to negotiate, but other times we have more. With the bid ask spread in options chains and the resulting spread in a combination of two options in one order, there is often room to negotiate, even on more heavily traded options chains. In a very heavily traded stock and options chain, the market will be tight, yet there will be a spread. Depending on the stock price the theoretical price of an option or spread position will always be right about at the mid of the bid/ask spread. We will rarely fill right at the mid since the market makers need something of an edge to want to play. But we can most often negotiate somewhere between the natural(bid in this case since we're selling a spread) and the mid. Notice on this options chain (after hours) that because the stock is very heavily traded, the options have quite high open interest. High liquidity makes a tight market. A tight market shows the bid and ask straddling the theoretical price. That's what we want to be aiming for.
Options markets are super efficient and any talk of market maker manipulating your position is nonsense, particularly if it is a liquid market.

Note that the shorter term in-the-money option has a slightly wider spread. It's hard to count on after hours prices as exactly accurate, but I'd read this as bullish. The ITM option has more intrinsic value and less time value to burn. Therefore, the seller of this Jan 70 option is taking on quite a bit of risk, more so than the ATM and OTM options with all time value, and widens the spread (the their cut of the action) to compensate for upside risk.

Now look at the chain for the Vertical spreads. The bid/ask spread is wider than for a single option on almost every spread. Yet the theoretical price is just about exactly in the middle. Because there are two individual sides to the trade the market can fill them individually or together. Whatever the case, we don't care, as long as we get the combination filled for our price somewhere near the theoretical.

Notice the odd fill I got for each individual side of the bull put spread. Someone out there in the market is willing to negotiate in odd prices. It's also possible that each side was filled in different places. Regardless, I got my fill for 1.30, better than the natural of 1.25.


I hope that was helpful. However, I want to make sure to distinguish between this kind of negotiating that with a normal stock purchase. Most stocks trade with a far smaller spread and this will not be nearly as much a consideration as it is with options. If you want to get filled on a stock order and don't want to wait around hoping for a dip and miss the boat(which I've done too many times...and then chased it like an idiot - don't chase it like an idiot), buy with a limit order on the ask price.

In other news, KBH looks read for a break of this flag and some upward movement. Ideal entry on the break of this line. Good reports from homes sales today and yesterday could mean a touch of enthusiasm for home builders.


Finally, if this chart of ISE doesn't convince you that technical analysis can be very useful in observing what's going on and being in sync with the market, I don't know what will. Do you think other people are drawing lines on this same chart too?

Friday, December 22, 2006

Double Tops

As we approach the year end and indexes are beginning to show signs of weakness, I though it would be good to look at the double top, a bearish reversal pattern.
Simply put, a double top reversal pattern is at the end of an uptrend where an M-like pattern forms. A new high for the uptrend is followed by selling off around 10-20% or more and a climb back to the high which then acts as resistance. If the stock or index then sells down from that resistance level and then breaks the low of the trough between the two peaks, it is a double top pattern.
Ideally, we want to see volume increasing into the selling off of the peaks and more modest in the buying up into the second peak. The pattern can take anywhere from a couple weeks to many months.
The pattern is confirmed on a break below the support from the trough between the peaks and, as always, a spike in volume makes the pattern all the more significant. Also, as with all support/resistance breaks, a retracement to test the line from the other side can be a great entry point.
To find the projected target from the pattern, measure the distance from the peaks to the low of the trough between them and then find your target at that same distance below the support from the trough low.
For a more official description, here is a good run down on the Double Top Reversal pattern from Stockcharts.com.
We've been pretty bullish in the short and long term lately, so finding lots of double top examples is not very easy. Here are a few, old and new:

The bursting of tech bubble shows us doubles tops on the NDX and the $NWX, the AMEX Networking index. The NDX(Nasdaq 100) firs put in its top in March 2000 with a shooting star and then a second effort at a new high, which failed. This formed a double top pattern when it broke below the lows between the two peaks. After that ran its course and reached the target fairly quickly, the market struggled back to about half its recent slide only to put in another double top pattern. The second peak of that pattern on 9/1/2000 was confirmed the next day as an evening star reversal candlestick pattern, giving further strength to the potential double top. It then moved down, broke support and completed the pattern by hitting its target fairly quickly.


While the NDX peaked in March, the NWX Networking index was still going strong until July of that year. Picture perfect shooting star candle with confirmation on 7/17/2000. (This pattern could be called an Evening Star Pattern, though the second day of the three day pattern is really supposed to have a gap up.) The second peak is completed with a bearish engulfing pattern on 9/5/2000, the same day the NDX put in it's final peak of the second Double Top pattern. All thoughts of bullishness in the tech world were gone from that day forward until years later.


There is no volume to support these patterns, but such is the reality with indexes. One could argue that the nature of an index being a group of stocks makes the factor of volume not as essential to the chart.

HP made a nice one early this year and shows subdued volume on the climb to test the first high and then ramping up volume in the sell-off at resistance. Picture perfect retracement to retest the broken support line for a bearish entry. Though it still hasn't reached the official target of $10 lower than the break, it made half of that projected move in the month of July alone.


It may be a stretch to call it a double top, but the NDX today broke what might be called a double top. The distance between the highs and the low in between them is only about 3% and this is a shorter time frame. But it would probably be a good thing if we were all on the right side of a 3% pullback in the market. The NDX 100 is referred to (so I hear) as "The Generals" since it is the big cap of the tech stocks. They are seen as leaders of the Nasdaq. If these guys are breaking down....Uh oh.
Here's a bearish article, Tough Times Ahead for Big Cap Tech.


To make it more fun and personal, we can look at ISE from our own little stable.
The formation is certainly there, but I'm not going to get too excited about this one just yet. Until it breaks the support, it's still just a potential pattern. Furthermore, the volume on the rise into the second peak was quite substantial and the sell-off volume hasn't been very dramatic. On the bearish side, though, we did break the uptrend and the stock with a P/E of 36.7 is trading at quite a premium to its group(P/E of 21.5). It has PEG of 1.65.


As these charts and others start to give us some potential bearish signs, now would be a good time to start looking for potential bearish charts for when the market does confirm a turn around.

Have a great weekend!

Thursday, December 21, 2006

Scrolling through the list

As the Nasdaq is looking ever more questionable and the SOX has definitely broken its uptrend support line, AAPL seems to have broken down in perhaps a very significant way. It has Definitively lost the horizontal and diagonal support and now it looks like the 50 MA too. That makes three strikes. Next likely support is at 78. The 200 MA is all the way at 70.

(Click images to see them larger.)


BHI is holding above 74.50 support and the 200 MA. Yesterday's inverted hammer made a bullish Harami.


The continued strength from COH warranted a mention from Mike Coval in Wednesday's Market Commentary.


CRDN is in a bull flag and holding above the 20 MA.


CTSH has a trend that looks a little long in the tooth and might be ready to break its Uptrend support and the 50 MA in one shot.


CWTR doesn't look very pretty and just bounced off the underside of the 200 MA. Chart shows a couple bearish divergences with the MACD in the last year. Interesting to see how common these are and how powerful a signal they seem. Here's an article on the subject.


HWAY looks to be warming up to breakthrough the 200 MA with the help of the 20 MA and support just below at 46.50.


ISE looks more likely to test the 200 than climb back up to the 50. The intermediate uptrend is coming in jeapordy with a test of the latest low.
A few posts back, I suggested a 50/45 bull put. I paper traded it and on the break of the support line closed it for a small loss.


KBH seems to be respecting the 200 MA and looks inclined to use it as support now. There is decreasing volume on the pullback from the recent high.


NTAP is right a the crux of testing horizontal and diagonal support and shows a potential double top with a bearish divergence on the MACD. Volume spikes recently have been on buying days.


RIMM had earnings today after close. There are a lot of writers pointing out overvaluation. The stock has more than double since August. But with earnings coming in at a penny more than the analysts' expectation, the stock was up over 5% after hours. Here's a good summary of the announcement.
With a fresh bounce off the 50 MA, if Friday closes up above 141, this could be a nice bullish entry for further upside movement. A Bull Put spread might be a nice conservative approach.
Implied volatility on RIMM ran up above 55% into this announcement. Perhaps there will still be a nice level of it to sell tomorrow.


UNT still has a longer term downward bias, but may find support at 48.80 and its 50 MA.


VSEA broke out big today, 5.7% on a day when the SOX is down 1.3%. Only news I could find was of a live webcast for their coming earnings announcement in January.


WCC looks to be having trouble. Continued selling today on big volume. 56.50 is likely support. Peter R. at Shadow Trader always says that volatility contraction leads to volatilitiy expansion. Notice the three Moving Averages coming together over the past few months. With the price now below the 200 with the others likely to follow, could this be the beginning of a more meaningful move down?
Perhaps a bounce a bounce off the 56.50 area support level could be played with a bull put spread for a bounce with the intention of buying back the short on continued breakdown.


ZMH wants to go higher though couldn't quite make it beyond resistance today and formed a shooting star which technically still needs confirmation, though the past few weeks have shown a number of bearish candle patterns.


It's interesting to look through the list and find that I'm still bullish in the short term for 10 of the 15 stocks. However, some of those "bullish" stances could easily change very soon: NTAP, CTSH, CRDN