Sunday, April 8, 2007

Market Posture and a close eye on CTSH

Because I won't be able to attend the meeting this week, I thought I would take my stab at identifying the trends of the market. In our last meeting we did a market posture that I recounted on the blog here. The end result of a very measured walk through all the angles was a bearish stance. It kind of stinks to do all that work and see the market rally in the next week. But should our stance on the market change?

Remember that this exercise is done with an emphasis on choosing an intermediate term stance on the market. That means a time frame of the coming 1-6 months.
  • Long term, still bullish. Higher highs and higher lows.
  • Short term, still bullish. Higher highs and higher lows. New high made this past week for this shorter trend. When we looked at it at the meeting, the higher low we had was just barely a higher low. It is now unquestionably a bullish short term trend.
  • Intermediate term, I'd say we've changed from Neutral/Bearish to Neutral. We discussed that the former long uptrend of higher highs and higher lows was clearly broken. We appeared to have put in a lower high, but now that has been taken out and we're waiting to see if we put in a new lower high or if we power back up to and through the former high.
Look at these three views of the SPY, which I used for the reference of volume. It seems significant that though the recent high that we spoke about last week was broken this week, it was done with very low and decreasing volume before the holiday weekend.
(Click it for a bigger view)


The Market forecast shows the green intermediate term line heading up with room to go along with the longer term sentiment line having turned upward. These are bullish signs. This chart even shows that the 20 MA is headed upward toward the 50, which the index has reclaimed.


The VIX has moved lower to the bottom of its recent range, but I see it sitting right on support. My reading of it is that it would be more likely to bounce up from here than move down. This has a bearish implication, but until that happens and even if it does move lower, I will read this as Neutral. Here is a weekly chart.


Putting all this together, I would read the result of this market posture exercise as cautiously bullish. But because the intermediate trend of the SPX was broken and is now still is in question, I'm reluctant to fully embrace this rally. Though I may put on bullish trades, I will keep them on a short leash and I will continue to watch for bearish trades.

Back on January 28, I did a post suggesting potential for a sideways market. Perhaps it was a bit premature and wrong to think of some nice and orderly sideways market. But I may have also been on to something. Given the look of things now, it would not surprise me to see the market stuck in a range between 1375 and 1460 or 137.5 and 146 on the SPY. That's plenty of room for daily and weekly turbulence.

In a recent post I included a potential bearish setup on CTSH. (it's toward the end of that post) The support line hasn't broken yet, but after an attempted bounce the stock has now bounced down from the 30 MA. Thursday's candle was a dragon-fly doji star, much like hammer in its implications, though it has yet to be confirmed with a higher close. But, as always, the primary consideration is support and resistance. Watch for that support line to break on big volume.


Have a great week!

Thursday, April 5, 2007

Watchlist ideas and an option play setup

Here is a list of some stocks I think might be appropriate for our watchlist. Some I know better than others and I haven't gone through them all with a fine toothed comb, but they fit the basic criteria. Kick the tires and see what you think.
(click it to make it grow)


One that is of great interest on the immediate horizon is SPN. Check out the resistance level just overhead. Well established and if it breaks through that with volume, I'd say there's a lot of pent up buying potential here. Many of the Oil Services have similar resistance lines, like GSF, for example. SPN has a PEG of .38 which is shockingly low, but many of the stocks in that group have similar PEG values, so I guess it's not that abnormal. The only thing I can think of as to why is that maybe they're at great risk down there in the Gulf with hurricanes blowing through every year.

This part goes out to Al. The flag setup on WFR from my last post triggered yesterday. The semiconductors group got an upgrade today and many of them jumped including WFR and VSEA. I placed a paper trade on it and thought I'd show you choices and plan.
The previous day's candle was a hammer or you could call it a dragonfly doji. With heavy volume on the day, it indicates a likely reversal. Yesterday's gap up and bullish candle confirm the previous day and you could look at the whole three day formation as a morning doji star pattern (very fancy stuff!). This is a bullish reversal pattern which fits nicely in the context of the flag already in place. The stock sold off from the highs of the day more than I'd like, but my judgement call was that the flag and the candle pattern and accompanying volume are good enough reasons to take the trade.

Setting up the trade:
It is a judgement call to say just how long the flag pole is, but I'm saying 6-8 pts. is in the ballpark. I'll have a target of 69 but look to take profits at 67 if it hesitates around there.
For my stop I didn't want to go all the way below the bottom of the previous day's low, but I wanted to give it some wiggle room below the low of the entry day. I chose 58.83 as the level for a contingent order to sell. That was $3 below the price at the time I bought the option.
So I am allowing for $3 of risk to the downside in the stock's movement.
I wanted to buy a call option, but nothing too slick or clever. I wanted enough time so I could sit back and let it work without stressing about time decay for a while and a strike price deep in the money so there was a high Delta. Look at the options chain below. Nice open interest out 'til Jan 08 and some even in Jan 09. Plenty of choices.
I liked the Oct 50 calls. Tight spread, good open interest and a delta of .80. Got a fill for $16.
My risk allotment for this paper account is $1000. I did this in a very simple way. 1000(risk allotment)/3(risk in the trade)=333. Rounded to the nearest 100, that makes 300. 3 contracts are equivalent to 300 shares. So if I get stopped out at the contingent sell level of 58.83, I'll lose no more than my acceptable $1000. In this case, I'll most likely lose less than that because of rounding down to 300 and because the delta is smaller than 1 and will decrease with each dollar the stock falls. If the stock takes all the way until October expiration to reach $69, the trade will show profit of 18%. But somehow I think the trade will run its course one way or another before then.

So to sum it up:
I bought 3 contracts of the Oct 50 call for $16 a piece.
I set a GTC(good 'til canceled) Market sell order contingent on the stock price trading at 58.83. I will watch for the target of 67-69. If the stock moves up quickly from here. I will put a hard stop at breakeven for the option.
Is that all confusing enough? (It's late.)

One last little thing to watch. CMG ascending triangle. Break of resistance with volume calls for a move of about 6 pts. This is what an ascending triangle is supposed to look like. A continuation pattern in the context of a bullish trend. The resistance level forms as a temporary blockade for the bullish momentum which eventually plows through it.
Very low IV on this stock.

Monday, April 2, 2007

This one goes out to Jack

Jack definitely gets the MVP award for pace setting in this group in recent months. Many thanks for setting a great example of how to trade in a disciplined way and keep it simple and consistent. Also, for sending us your info-packed emails.

The latest one with your watchlist and recommendations for our list came just before our meeting and I hadn't seen it until after we met. Sorry I've taken this long to respond to it.

Of the three stocks you specifically recommended, WFR, SIMO and DRIV, I really like WFR and would prefer to leave the others.

DRIV doesn't have an F/E score above 3.25. That's an easy place to set the bar, so let's stick to it.
SIMO looks like a stock worth following, but the volume is a bit under the 1 million level and as a result the options chain is a bit less populated than we'd like. There are only 4 months available and open interest throughout the chain could be more consistent. As a result, there are certain contracts which have a spread of .40. For example, in order to do a longer term, in-the-money call purchase, one would have to deal with a spread of .40 for the June 17.50 and .50 for September 17.50. (Again, this is after hours, so maybe it's better during the trading day.)
Regardless, the stock is up 100% in the last 8 months and it just took a hit on potentially bad news for the group. Hard not to feel like this was a momentum play that has played out.
I should note that it hasn't yet broken its recent trend or made a lower high or low yet, but the volume on the gap down is significant. I would say that until the stock breaks through the 24/25 area, it shouldn't be messed with on the long side.
(Click it to make it grow)


Now for WFR. I really like this one. Beautiful fundamental scores including very high growth rates both historical and forward looking estimates. It trades an avg. 4.8 million shares a day which results in a nice and liquid options chain. Lots of choices for months(even LEAPS) and strike prices with most of them showing quite high open interest and tight spreads. Even for those who aren't so into options trading, it's nice to at least have the option to sell covered calls or hedge a position you are in while it sits sideways or pulls back.
The only striking downside at the moment is that it is part of the semiconductors group which is looking pretty sketchy as of late. However, we can take the great relative strength of this stock to the group as a very positive sign for when the group does gain strength.
Here's the SOX on a 2 year, weekly chart. Looks very indecisive at the moment, but if I had to make a guess at which direction it would break out of the recent consolidation, I'd guess down. Wait and see.


WFR, in contrast looks like a very strong stock. I'll show the 5 year chart first to point out a bit of what we talked about at the meeting with respect to Bases as taught by Investor's Business Daily and "Proper Buy Points." The idea is to buy when it breaks out of a quality base (various structures that basically make up a period of consolidation or pulling back between resistance and support - a cup and handle, for example) with very high volume. If bought at these proper buy points, you are more likely to be able to hold a stock during mild pull backs because you have a cushion of profit to work with.
The stock has double since mid 2006, so we might be nervous about jumping in here. But the picture looks a bit different when we realize that the low in 2006 was a very healthy pullback after a gain of about 550% between late 2004 and early 2006. The most optimal recent buy point was the breakout during the week of January 22 or even the bounce off support during the week of March 5. But that doesn't mean we can't jump on for a ride at the right time.

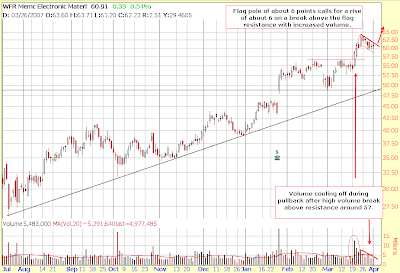
Looking at the daily, the recent shoot up above resistance has pulled back to form a flag. A break above flag resistance with volume would theoretically have a move of about 6 points, depending on how you draw the flag pole. I've done it from the move above the recent resistance line.


The markets have been very ambiguous lately. There seems to be a bearish tone to things, yet certain stocks like WFR are acting quite bullish. It would make sense to keep some trades alive on both sides of the fence. For a bearish idea to watch for, we can look to our recently whittled down list of strong stocks. Go figure! CTSH has taken a hit this week and I can't see any obvious news to account for the reason.
Since the stock popped above its 2005 consolidation in early 2006 it has trended very steadily upward. I thought we might be building strength to break through recent resistance, but though its support line hasn't broken yet, down looks more likely than up. The MACD and Stochastic on the weekly chart would support that view as well.


On the Daily chart we have three red arrows and a very clear double top formation. The height of the top pattern measured from resistance to support between the two peaks is about 10 pts. A break with volume below that support line would project a target of 10 pts. down to 75, which also happens to be a former support level from December. For further support of the bearish case, notice the bearish divergence between a lower high on the MACD and an equal high in price.
I would give this move about 2 months to play out and buy an extra month of time in the option. The big question is whether or not to go short on the initial breakdown or wait for a test of resistance at 85. After 5 down days in a row, I would think at least a few days of relief from the selling should be in store. (I say, "Go short," meaning either sell short stock or buy puts.) If the breakdown occurs on big volume, that will be the big signal to take the trade.
As always, buying an in-the-money option is an easier way to control your risk and maximize dollar gain in the option as the stock moves(because of the higher Delta). Buying at or out-of-the-money options is trickier because there is no intrinsic value and you are much more at the mercy of implied volatility and time decay. However, if implied volatility rises and the stock does move in your favor to pick up intrinsic value, your percentage gain will be significantly higher than with an in-the-money option.


Jack mentioned in his email and asked in the meeting about having a bear list with a minimum F/E score. I responded perhaps in a flippant way that, "you want crap fundamentals with a crap chart for an ideal bearish setup." In theory, I suppose that is true, but we also have to consider that a crap chart has perhaps already been beaten up pretty good. A great performer still near the top of a fantastic ascent will have much further to fall and therefore could be much more attractive. Becasue the stock market is a forward looking mechanism that discounts all factors, it would make sense that the chart would actually precede the breakdown of what were or are still very strong fundamentals. KBH would be a good example of that happening. So with that said, perhaps it's not a bad idea to look at fundamentally strong stocks that have bearish reversal patterns going on. But to specifically require a certain fundamental strength for bearish candidates seems a bit overboard.
Again, thanks to Jack for all your input. I hope this is helpful.