Sunday, December 9, 2007

How and Why of the new additions.

I am still in the process of putting together a step by step run down on my approach to creating a bull watchlist. In the meantime, here's a quick and dirty run down on how I/we came up with the resulting additions to the current watchlist.

First, I ran a Power ProSearch with the following Criteria:
(click images to see them larger)

From the resulting list, I check only those stocks whose charts look neutral or strong with potential for new buy signals in the near future. Those stocks were saved as a temporary watchlist.
From that list, I eliminated any stocks whose group charts were not at least neutral in the last 2-3 months. I also tagged any stock whose group was looking very bullish for added emphasis on those stocks.
Next came the much more subjective and somewhat "artistic" part of the process. Widdling it down by valuation (PEG no higher than 2 but the lower, the better), relative strength in the chart compared to the group and the market, and various newsy considerations.

Here's quick few words on the appeal of the new additions:

CBI - Strong and healthy looking chart, constructive group chart, PEG 1.5


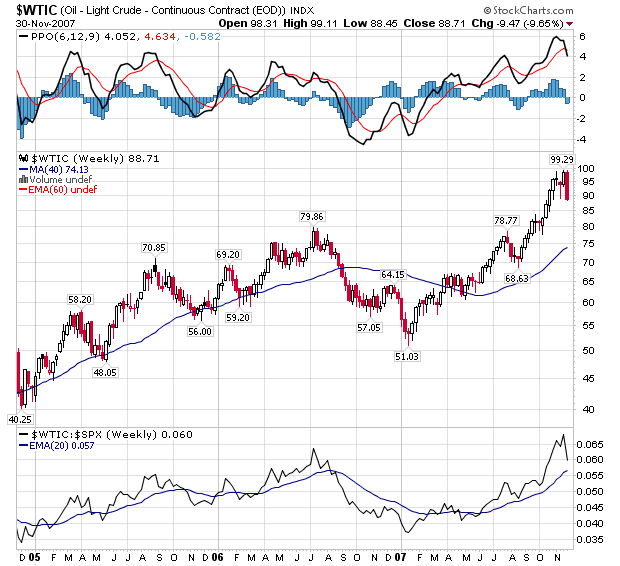
CHK - We needed Oil & Gas Producers group representation and this chart looks consistent with that group chart, holding up better than oil services. PEG of .55, very low. Low P/E compared to its group. And finally, as a major natural gas company, if natural gas continues to test the 8.5 level as it has in the last year and finally breaks it, this stock will no doubt respond favorably.
Long term chart looks quite nice. Sideways for quite a while there and now moved above that level for sure.


CYBS - PEG of 1.64(at the time, now 1.76), but using the next fiscal year estimate instead of the 5 year estimate, the PEG is much lower. Growth estimate for fiscal year ending 13/31/08 is 56%. That's pretty serious, particularly with a P/E currently of 44. Group chart could be stronger, but it's certainly not bearish. But the stock's chart itself looks fantastic. Big volume gap up on earnings in Oct. Settled back into support and looks to be trying to break above this consolidation area. About 15% of float share are short, so that could make for some nice short squeeze potential. (Of course it also says something about the market's confidence in this stock.)


JASO - Though grouped with with the semiconductors, this is a china-based manufacturer of solar cells, selling mostly to china, but also Germany, Sweden, Spain, South Korea and the U.S. Solar stocks have been showing themselves as the real deal, it seems, and this one supplies some of the stronger companies. ROE of 28 is quite nice. PEG of right around 1 and about .75 using the growth estimate for next year instead of the 5 year growth estimate. Perhaps it's a bit early to feel super confident in the consistency, but the quarterly growth is noteworthy.


Very strong looking chart.


PRGO - I like the looks of the Biotech group knocking hard on resistance. PRGO had a huge volume move up. Maybe a bit far a bit fast, but after it consolidates a bit as it is doing, could be a nice mover yet. PEG - 1.57, but again even better using next year's growth instead of the 5 year estimate. Very low P/E compared to its group. Regardless, the recent breakout is quite bullish. Those two days were on about 4X the average daily volume.


SNDA - China online gaming stock. ROE of 50! Earnings growth has been remarkable, yet the P/E is only 15 with a 20% growth estimate. PEG of less than 1! This type of valuation is fairly consistent with most of these promising china stocks, so perhaps there is more risk here than we know. Nevertheless, the chart looks good. Paused for consolidation in the last two months. Pretty big volume earnings jump in late Nov. Resistance at 40 looks bound to be broken soon.


STLD - The Iron and Steel group looks quite strong and this stock looks right in step with pushing its high. PEG of 1.79(though this comparison is apparently less useful or consistent with commodity stocks due to volatility of the underlying commodity). Very strong growth estimate for next year compared to the group. P/E just under the group average.
Very nice chart.


Wildcard: LIFC - This is a "wildcard" because it doesn't have our required 500K average daily volume. Not yet, at least, and just barely under.
Again, I like biotech, though I think this stock may be better suited to some other kind of medical tech. group. Anyway, very strong sales and earnings growth last year. PEG getting up there at 1.85. But Quarterly earnings growth has been quite consistent.

Strong chart. Nice daily volume this past week on the breakout above recent highs.


I should bring attention to one potentially dodgey issue and that is that there are quite a few china stocks on our list. CMED, JASO, MR, SNDA. Not too similar in their businesses, but China nevertheless. I tend to think it more reasonable to place less emphasis on the groups they are placed with and more on a comparison to the China stock market. I use the FXI.

Let's hope all the new recruits turn out to be great additions.

Friday, December 7, 2007

Hot off the press. Updated Group Watchlist

(updated to reflect CHK/ESRX slip up)

Cut:
AOB - Price Pattern 2.25 (But keep an eye on it. Constructive big cup pattern. Set alert at 14.
BLUD - Price Pattern 2.25, sideways, choppy chart for the year, bad press (SEC investigating)
DIOD - Low F/E, Price Pattern 2.25
FMCN - Group chart makes it not buyable according to our rules. (Even though it's a China stock and who really knows the correlation to this "group." )
HLF - Drastically under performing its group. Bad press. Price Pattern 1.75
SCRX - Yuck! Nasty chart. Price Pattern 1.5
NOV - Oil services looking iffy and RIG is enough representative
CAM - Same reasoning as for NOV


Add:
CBI
CHK
CYBS
JASO
PRGO
SNDA
STLD

Bonus Wildcard:
LIFC - Strong fundamentals, BUT avg. volume 492K. Just a touch under. I doubt it'll stay that way for long. BUY BUY BUY.

In all its glory, the new money pool:


On probation:

PCP - Iffy group, clinging to resistance. BUT, ROE of 28, Nice, consistent track record for earnings and sales growth and meeting estimates.
(Find this on info the "Quarterly Earnings" link.)

Click to see it bigger.


Comments, thoughts, insights, totally off-the-wall trade ideas all welcome.

Wednesday, December 5, 2007

ZOLL

Isn't it great when one of the trades you go public with just turns right around and bites you in the as*?
Just to give an eye to ZOLL which I mentioned to the group, anyone with most any combination of moving averages and indicators would avoid this stock as a bullish play, particularly when looking primarily at the last 3 months.
It's really not all that important which set of indicators you use, if any, but the price action tells the story regardless. Short term trend is certainly down. Intermediate to long term, though, has a neutral/bullish picture to it.
MA's certainly pointing down. Not much more to say. And sure, descending triangle even (though not yet triggered, and therefore still only "potential"). So was/is really still just a support line that is still holding. Just as reasonable to play a bounce when it doesn't breakdown as it is to short it when it breaks down.
In any case, here's what the long term looks like with my markings and no indicators. I think you'll understand my thinking on the trade a bit better by seeing my view of it. It was to bounce at support and go to a target of 27. Stop would get me out if it went the wrong way. And so it did, but it still may prove to be a whipsaw. Am I confident in this trade enough to enter again and maybe even again? No. On the intermediate to long term, it really is at best neural and not so bullish. I may have jumped the gun trying to get in early here. I could still work out. The recent candles seem to forecast it stillbeing a good play off these bottoming hammers. But it's probably safer to look at it again once it convincingly gets above 24.50 but better yet 27. Though I like the idea, I've never really played sideways channels, so I should think more on that instead of trading sideways just because the Market seems somewhat neutral.


On the daily, it did seem to be bouncing off support, but the candle sticks were not clean and clear in the support of the bounce. I liked that volume was picking up with the bounce, but somehow I let that overweight what the price action was telling me in the form of a spinning top, a picture of indecision.


One of the things I wrote down twice a the workshop with Dave Johnson was, "Volume is secondary!" I need to repeat that to myself. Another lesson reinforced. Candles beat volume. The other glaring issue is that the downtrending resistance line was breached intraday, but still not closed above.
Simply put, I jumped in earlier, closer to support, so I could get a better risk/reward and tighter stop/bigger position.

Saturday, December 1, 2007

Market Posture for the Holidays. Feel the spirit!

I like going through the market posture on the weekends. Not so much because it's so different from a day or two before, but because you can look at the bigger picture using all complete weekly candles. Looking at this way tends to smooth out the noise of each individual day and somehow makes the process a bit easier and perhaps more objective.
Here is the Market Posture Grid as filled out at Thursday night's meeting.
(Click on image to see it bigger.)


Below is the weekly chart for the SPX. It's hard not to notice that there is a very clearly formed double top formation in process. But like any pattern, it's just a potential pattern until it is complete which is when the support line is broken in this case. It's also very apparent that the higher high is less of an improvement than the previous higher highs. Same with the higher low, and on the daily chart it's more of an equal low. Nevertheless, the intermediate posture on the SPX is still arguably neutral due to no major lower low and still having no major lower high despite the clearly bearish short term trend. What further supports an at least neutral intermediate posture and potentially bullish short term posture is what looks like a possible short term reversal at significant support. This week's candle is clearly bullish(engulfing and then some).
Thursday night we spoke about potential points of resistance to look for in this market rally. Having been a very significant point of support and resistance many times in the last five months, 1490 seems the most obvious level. Interesting to see the rally peaked out just a dollar short of there intra-day on Friday.


The weekly VIX chart also shows some reason to be bullish at least for the time being. The long term trend in the VIX is clearly up and this is a long term bearish indication, but remember that it is the intermediate and to some extent short term that we should be most aware of, as the "long term" shows us what has happened somewhat long into the past. The Intermediate and short term will give us a better idea of what to expect for the immediate future.
On an intermediate time frame, we have a lower high even if just slightly, and a lower low from mid August to late September. Looking a the bearish reversal candles in beginning November, we see that they have been confirmed in the past week's lower close. Furthermore, this week, we got the important piece of the puzzle we were waiting for which was a lower low on the short term VIX, a movement below daily support(and former resistance) just below 24.


For the final component of the Market Posture routine as taught by Investools, the Market forecast is giving us a clear bullish reading on the intermediate term with the green intermediate line having moved upward out of the lower reversal zone.
There is also seen one of the major "signals" that the Market Forecast indicators give which is the "Near Term Divergence." This is where the blue Near Term line puts in a higher low while the SPX itself makes a lower low(opposite for a bearish divergence). As with any signal, it doesn't tell the future or work out every time, but in this case it has worked out at least short term.


It's hard not to feel the fear in the air and even to notice that the SPX is still under the 200 MA even with the rally of the past week. I'll let you do the process with the Nasdaq, but it's interesting to note that doing the three pronged posture in as objective a way as we could, we came up with a Bullish posture for the Nasaq and Neutral for the SPX and only then looked to note that the SPX is below the 200 MA and the Nasdaq is above it. Perhaps it is not earth shattering news, but noteworthy nonetheless.
There are certainly lots of things to be worried about with the economy and even the charts. But there are also potentially positive factors for the market, so who knows?
I won't list the negatives, but as for a few potential positives from one who is FAR from an economics guy, how about oil prices finding a potential top?

How about the weekly bearish engulfing on the Yen at long term resistance? It may be short lived, but it looks like it needs to come back in a bit before moving higher if that's going to happen.

How about the plunge in the US Dollar coming to a halt at least for a while as is shown possible by the bullish engulfing candle on the weekly chart? It's awfully far from the 40 week MA.


This may be grasping at straws, or however that saying goes, but the home builders have just been relentlessly hammered for a long time. Even if the outlook is still far from rosy for them, an end to the plunge is inevitable at some point. We know that all homebuilding in the US will not come to a complete stop and therefore the homebuilders will not go to zero. (All you gloom and doomers, yes the apocalypse is the exception.) Though far from a convincing bounce just yet, we do have a bullish engulfing at an old support level and even bullish divergences on both the MACD lines and the MACD histogram. I can't remember who, but I believe someone from the big name investors out there announced taking a major position in one of the homebuilders this week.


For an even more thorough feel of what "The Market" is doing, I encourage you to build a watchlist of the Sector Spiders. 9 ETFs that as a general snapshot show you the action of the market in 9 clumps of related stock groups. There are many ways to look at the sectors of the market and the "sectors" seem to be defined differently by all, but this seems about as quick and easy as any. Notice that the XLF put in a monster bullish engulfing on the weekly chart with its highest weekly volume to date.

I do realize that my showing only the positives and not the negatives seems an awful lot like being a bullish cheerleader. But really, I just want to focus on the positive a bit, because all we've heard about lately is the negative.

There is, without a doubt, downward pressure on the SPX and tough resistance at 1490 even with this week's rally. I will look to 1430 (support from the inverted head and shoulders in August) for a potential level of support. Just about all of the above will probably be null and void with a decisive break below 1406. With a real break below 1375.......Look out below.

Thursday, October 11, 2007

KGC Flag breakout

Here's a trade I took today.
Gold has been looking great lately and consolidating after some major gains. There is a symmetrical triangle of sorts going on for the last 7 trading days or so. Will it break higher from here? Looked like it was going to today, but then it came back off the high. Check out the chart for gold here.

In any case, the gold stocks have been doing very well as is illustrated by the $XAU (the GDX for an ETF) or the $GOX here. It has broken through some long standing resistance from a big sideways range and even showed new support at last month's resistance level from which to move higher.

(Click image to see it larger.)


I chose to enter KGC today for a stock play as it looks to have broken a bull flag on top of a serious flag pole. Like most stocks in the gold group, it doesn't have a 3.25 F/E score. Honestly, this is more a technical trade than anything, but looking over the fundamentals, I'm still happy with it.

It has good sales and earnings growth in the last year. Very good earnings growth. The Estimates are a bit spotty, but all together acceptable for me. PEG using the 5 year annual growth estimate of 10% is about 3, which is way to high. But using this year's estimate of 47%, it is well under 2. Also, I like that the current P/E of 31 is well below the group P/E of 64. Finally, it has met or beat its estimates every one of the last five quarters and the analysts are mostly favoring the stock.

Long term view shows volume building steadily to a high volume month in September with a big bullish candle. October pushing higher so far and a very old level shows 20 as a likely resistance level and great target.


A slightly closer look at the weekly chart shows some stepping up through bases. Three weeks ago broke through resistance on high volume.


Finally, the daily chart shows a serious rally with the price of gold and a flag developing as gold consolidates too. Today's break may be premature, but it had a nice volume spike, so I took it.
The Flag pole is about $4 high which, tacked on to the upper line of the flag, gives a target of about $19.25. I bought at the end of the day at $15.68 sizing my position for a stop loss level of $14.25. This gives me a risk/reward ratio of 1/2.5. If I let it go to the 20 area shown on the long term chart, it is a bit better.


I will let the stop take me out to the down side. If and when it reaches the $19 area, I will consider whether to take 1/2 at 19.25 or go for all at 20 depending on market conditions and gold. If conditions warrant it, I will let it run and trail a stop.
It is possible for these targets to be reached before earnings come in on Nov. 7, but unlikely. I am prepared to hold over earnings.

GO GOLD!!!!

Monday, September 10, 2007

VIP Buy signal

When we came up with the first five stocks in our new list, VIP was one of them and quickly gave a buy signal according to our group rules. I emailed the group asking how one might view this and place an order to buy. I failed to specify that I meant it in the context of our group rules. Nevertheless, I was a bit disappointed to get only a few responses to the question and none that answered according to all of the work we had done lately on developing a group system dissecting the Investools method. I know that we had yet to "officially" start paper trading the group list, but still the exercise is a good one.

So here is the question from August 31 and roughly what I was looking for:

Q: Would anybody venture to explain why VIP should be a buy today? And to set up how the trade would be sized for 2% risk on a 100K portfolio? How many shares would you buy and what would the order to be placed look like?

A: VIP is in a group ranking in the green on the big chart and one that showed sideways to upward movement. The stock was in a long term uptrend but had recently pulled back from a potentially strong resistance point and even formed a short term downtrend with a lower high and lower low as outlined the in the downward channel on the chart. It gave 3 green arrows, but in the context of a sideways to downward moving stock(with the MA moving downward), it should be considered not buyable. However, on 8/30 it broke out above resistance with double the average volume. This qualifies it as a breakout buy.
(Click on images to see them larger.)

One of the rules we had come up with was to not buy stocks that were more than 10% away from the MA. This would disqualify this stock, but my feeling is that that would prevent a buy of almost any breakout buy. So I think it is appropriate to apply that to breakouts as "no further than 10% above the broken resistance level/expected new support level." This is an example of the type of thing that will show up and need discussing/deciding in the process of trading and refining our system(or any system). (I now look back at the rules and see that it does include specification of 10% above the MA OR BREAKOUT SUPPORT LEVEL. Perhaps it could be worded more clearly, but that does give the go ahead like I just described.) The official group rules can be found in the "Files" section of our Yahoo group.

The resistance line as I've drawn it was 23.41. (Remember that these are areas, not exactly lines. Part art, part science.) With a close on 8/31 of $24.73, it is about 5% above the breakout level/former resistance/assumed new support level and well within our 10% requirement.
Now to figure out how much to buy and place the order.
With a $100,000 account and a risk tolerance of 2%, we are willing to lose $2,000 in this trade. To figure out our position size, we must first figure out where we'll put our stop loss (stop sell) order. We will use 3% below the assumed new support level. To use a simple round number and to give it just a touch more room due to market volatility, I'll use 23 as the new support level. To easily find 3% below support , multiply that level, 23 x .97. That gives us $22.31.
So now we know that we're going to place a buy order at a limit of $24.73(the closing price on the breakout day) with a stop loss order at $22.31. 24.73-22.31 gives us total risk(potential loss per share) in the trade of $2.42.
We then take our acceptable portfolio loss amount of $2000 and divide it by that number representing the risk in the trade. $2,000/2.42=826. We can buy 826 shares and be perfectly positioned for our calculated portfolio risk as tailored to the risk in this particular trade.
But because I would prefer to deal in round lots because it's simpler and matches up nicely with potential hedging with options(buying puts or selling calls) I'll round down to the nearest hundred. So 800 shares it is. This will use $19, 784, under our limit of 25% of our account.

For market open the next day, I place an order to buy 800 shares of VIP at limit of 24.73. Using a "1st trigger sequence" order on Thinkorswim, I line up a second order to be triggered upon filling so that there is instantly a standing "stop sell" order to sell 800 shares of VIP if the stock goes to or below $22.31.


Here is what the order should look like. Notice the GTC(Good 'til cancel) on the stop order. The buy order has a day order, meaning that it would expire if not filled that day. Upon expiration, it would also cancel the stop order.

The next morning, the stock gapped higher at the open and then came down to fill the order at $24.72 at 9:55 AM. The level has held and the position is showing a profit of 1.82%, which is encouraging considering the carnage on Friday in particular.

I hope this has been clear and helpful to those who are still uncomfortable with how to setup a stock trade and place the appropriate orders. Please feel free to chime in in the comments section with any questions or comments.

Saturday, September 8, 2007

Pavarotti - Nessun Dorma

Luciano Pavarotti (1935-2007)

R.I.P., Pav

Thank You.

Thursday, September 6, 2007

New Group List! HOOOOORAY!

After going through the search process and narrowing it down over two meetings, we now have an official new group watchlist. It's surely not perfect, but I'd bet it's as good as any. As always, I firmly believe that the real challenge is not finding good stocks, but trading them well and consistently.
If nothing else, notice that all of the stocks are moving sideways to up over the last year. The Trend is your Friend!

Drum roll please........
(click list to see it bigger)


Now with the list in place, we can progress further with our process of developing a system of rules and trading using the Investools method.

I thought it might also be of some interest to those who didn't and even those who did attend, to see my little writeup on how to go through this process. I know there are many ways to build a list and some might spend much more or much less time and scrutiny in the process, but this is just how I've done it when approaching this kind of list making. Remember the list I made in April and have referred to in recent posts. As a basket of stocks, that list is up 28% from that day in early April to today's close. So I believe it is a good approach. Of course, that came out right as the market was about stage a major rally. But it seems that this could also be the beginning of a new rally, so being prepared would be a good thing, just in case.


Building a watch list of fundamentally strong stocks with relative strength, both technically and fundamentally.

Goal: Build a list of stocks that are fundamentally strong from a diversified selection of groups and showing relative strength to their groups and the market. This is intended as a bullish watchlist for intermediate to long-term trading/investing.

Most general requirements for doing a Power Pro Search:
F/E – 3.25+
Price Pattern – 2.5+
Minimum Price of stock – $12.50
Average shares traded daily – 500,000
Group chart sideways to up

(What I forgot to do, but intended to do, was to include a search parameter in our PowerPro Search to require a minimum of 3.25 for the Estimates score. That way, we know that the weaker of the two scores going into F/E would not be the forward-looking score. Something to keep in mind for the future and your own searching.)

Ways to search for stocks for a diversified list:

• Do a PowerPro Search with the above criteria. In case it doesn’t result in a sufficiently diversified list, look to the following search methods.
• Look at the sector and group indexes for ideas where to drill down. This is easily done from the “Market Posture” link in the left column of the Strategies tab page.
• Look at Big Chart for groups moving up the ranks. Going from red to yellow to green is ideal. This helps to find the groups coming into favor before they’ve already made their runs. Drill down in the appropriate groups.

Narrowing it down: PRICE IS KING!

Look for a healthy looking chart for the potential stock. Most general rule is that it should start in the lower left corner of the chart and end in the upper right corner. Pretty simple, huh? ☺
Compare the stock’s technical performance with its industry group and the market. We’re looking for relative strength, meaning that the stock is leading its group and the market.

Narrow it down further by looking at the fundamental components and the valuation. Again, we're looking for relative strength. Note the P/E in relation to that of its group. If it’s cheap, great. If it’s trading at a premium to the group, that might be a good sign. Whatever the case, be aware of it.
Look at the PEG – P/E divided by the growth estimate. It should be lower than 2. 2 or above is considered expensive. Under 1 is considered quite attractive. You can also find the PEG on the “Valuation” page found from the left column of the corporate snapshot page on the Investools toolbox. This is not so much an Investools taught approach, but it can only be helpful to use. Think Warren Buffet. He does allright with the value approach.

Saturday, August 11, 2007

Big picture posture

I don't normally look at the Dow too heavily, but with all of the talk about global expansion and the industrials outperforming due to their exposure to overseas growth, it's interesting to consider the Dow in addition to our normal go-to indexes.
Though the breakout to recent highs did breakdown and ultimately "fake out" fairly quickly, there is still a strong and in tact long term uptrend with a trend support line just below us. If that doesn't hold, the next likely area of support would be 12,750. After the recent craziness and fear as high as I can remember in recent years, is the Dow really likely to fall another 500 points in the coming weeks? Remember, the crowd usually gets it wrong, or so they say. I suppose it's possible this level will break and the quick drop to 12,750 could happen. After all, it's really only 4% and would actually finally achieve the 10% correction that so many have longed for. But again that is a strong and healthy long term uptrend in 30 mammoth stocks that don't just get going or turn on a dime. Even if we are destined to test that area for an "official" correction of 10%, the past two weekly candles are pretty major inverted hammers, showing an inclination to bounce. We shall see.


SPX is also still in good looking long term uptrend, though the breakdown after the fake out of the trading range at the top does seem a bit more severe. The trend line from the mid '06 lows is pretty much broken. But there is almost surprising support from the old channel resistance line in blue. Also the weekly candle shows an inverted hammer like the Dow. If this area doesn't hold, the next likely area of major support is 1,380. After that, all the way down to 1,325. The first level would be roughly an 11% correction from the top, the second would be almost 15%.


For a closer look at the SPX, I'm going to be a bit obnoxious and put up a chart with way too many indicators and lines. Basically, I just don't want to do a third SPX chart. One thing that I think is quite interesting, though I'm no Fibonacci pro, is that the low from last week that provided intraday support again this week is right on the 38.2% Fib retracement line, the first of the most significant retracement levels. The 200 MA is also providing support in addition to the diagonal and horizontal support lines present on the weekly chart. In total, there are 5 support lines of one kind or another, including the fib line, around the current price.
The Market Forecast indicator is actually quite bullish, save for the longer term sentiment indicator, which is heading down with plenty of room to go. But after last week's cluster, the intermediate term green line has exited the lower reversal zone for the official green light on playing the cluster. To strengthen the bullish argument being given there, the momentum and near term lines are lining up for a nice "Intermediate term confirmation" signal, another of the signals Investools teaches on these indicators. In short, the two shorter term indicators line up to be the wind at the back of the intermediate term line.
In short, I'm expecting a bounce here. But the real test will be when the index tests the bottom side of the old support and recent resistance line at the 1490/1500 area. If that holds as resistance, we'll likely see some serious sideways choppy action for a while or possibly another leg down and potential beginning of an intermediate term downtrend.


I think I showed VIX with a weekly chart last time, so I'll just stick to the daily. It's rocketed only higher and seems very likely to come in some. Even if it is destined to go higher, there needs to be some kind of retest of the new range support. I just can't imagine the VIX going parabolic without a true market crash happening. Regardless, it is clearly telling us that fear is high right now. It's also telling us to be on our toes for a peak, as once it is high and then turns, THAT is the time to buy. So my take is that this is very close to being a bullish indicator right now. One point of interest from this past week is Wednesday's action. Though the SPX had a big strong up day, the VIX did not have an impressive down day and actually couldn't break below the recent support/old resistance level at the 20 area. I took this at the time to mean that the up day in the SPX was not to be trusted because people were still buying puts heavily. But really, just look at that Doji star hanging up there. Can it really go higher in the next few days? Of course it can. But is it likely? I doubt it.


The Russell 2000 small caps index has shown much relative weakness in recent weeks, but this week was quit strong. With what we could call a bullish engulfing weekly candle, it seems to not want to give up these support lines, both diagonal and horizontal.
With all the talk about how strong the Big Caps are, could this be the time to get into small caps? The long term view seems to indicate so.


Again, I'll leave the Nasdaq up to you. But here's my thinking. The Dow still shows the most relative strength. The SPX, with many more components to it, is still strong in a long term sense, but the short term is looking a lot more shaky. If the Russell and the small caps bounce from here, the small caps may finally wake up and actually provide a bit of support to this market. I would think that would only help the SPX regain its composure next to the Dow.
Take a look at the Nasdaq versus the Nasdaq 100(NDX). The NDX looks stronger than the composite as a whole, which makes sense considering the NDX is the 100 big boys. If the smaller guys, many of which are surely in the Russell 2000 can get it together, perhaps the Nasdaq composite can work its way through the congestion of "overhead supply" it has to deal with.

Any comments? I dare you.

Bueller?

Monday, August 6, 2007

Making a list

We spoke about making a group list together at the next meeting. We're still working on the group rules, but perhaps we can squeeze a bit of list talk in there too. As IBD always points out, corrections or bear markets are a great time to build new lists for the new bull market or next rally. It sure was a good time to do so in March.

As a bit of reference I wanted to point you toward the last bit of posting I did on making a list. We don't HAVE to do it like that. It's just the way I did at the time and shows a bit of my thinking on the subject.

Back in march I made list and did a post explaining a bit about my thinking for the list at the time. It focused much less on the strong group of the time and more on strong stocks in various groups. Here's the post on the Watchlist Criteria. It was posted on March 31 just before the SPX was successfully tested as new support the old resistance from the middle point of a very clear double bottom reversal. Very nice rally happened from there.


A proposed list was put up on April 4. I made a portfolio out of it with 1 share of each stock at a purchase price of that day's close for each. It doesn't say anything about trading them, but the success of the basket as a whole since that day speaks volumes to the merits of strong fundamental scores and some of the considerations I explained in the post about criteria. It also speaks to the value of relative strength, be it versus an industry group or the market as a whole. This should also be a consideration for our new list.
Here is the latest status of that list from April. After being at around 30% profit in recent weeks, it's now showing 19.6% profit. Not bad for just over 4 months.


As for the WFR trade I setup in that post, it got stopped out on 4/13 for 13.60 per contract and a total loss of $720. Perhaps the stop was a bit tight and I wasn't happy to miss the quick rally to follow. But I certainly was not upset to be out of it when it gapped down big on earnings.

The CMG triangle in that post didn't quite pan out as a stellar ascending triangle liftoff, but a kick ass earnings call sent the stock off strong.

I like Ben Stein's articles. Always a very level headed take on things. How Speculators Exploit Market Fears.

Thursday, August 2, 2007

Market Posture, again. :)

My Gosh! Is it really over a month since I posted a blog? Interesting, though, to read the last one. Not a bad read on things, I think. And VSEA has done well since then. Today was a seeming breakout that I almost bought. But because it was a resistance breakout with less than 150% average volume, I decided to pass, particularly considering the shaky nature of the markets at the moment. There was a lot of buying going into close, but in after hours it sold off a good amount of the day's gains, even if on low volume. It remains one to watch.

In any case, here's the rundown on what we came up with for the Market Posture. I want to remind that the intention is to come up with a posture for the intermediate term, meaning not what's going to happen tomorrow, but what we might expect in the coming months. And also, because this was a tough one to call, I want to emphasize that technical analysis is as much or more art than it is science. Therefore, we will all see things a bit differently. Because I was leading the exercise, it is of course skewed toward my take on things. Others had at times slightly different views. Whoever is doing today's Market Wrap on the Investools site might have a totally different view. There is no "right" answer. We're each entitled to our own interpretation of things and should become well practiced in making such interpretations. That's the whole point of the Investools education.
Without further ado:


SPX:


On the shorter term, while the recent downdraft feels awfully bearish, there are quite a number potential support lines just below us now. Furthermore, though the shorter term and even intermediate uptrend clearly broke, there is still no official downtrend when considering a trend as a series of highs and lows. As a result, the SPX chart was considered Neutral.


Market Forecast, is bearish because the green intermediate line is the lower reversal zone. Market sentiment line also bearish with tons of room to go yet.


Finally, the VIX. The Volatility index, or as some people call it, the Fear Index. Without even looking at it, would you guess from the market lately that fear is high? The Vix surely supports the thought.
"When the VIX is Low (and turns up) it's time to go (sell)." "When the VIX is High ( and turns back down) it's time to buy."
It is high now and possibly turning back down. But it really hasn't yet. But it does seem like a pullback or breather would be necessary for it to surge yet higher right now. Therefore, we called it Neutral.


What is really interesting is to look at the very long term chart of the VIX. This is as far back as the data goes. I remember thinking and hearing in the past year that perhaps the days of high volatility were over. Better technology, more sophisticated markets, better risk control. Perhaps not.
It has moved back above what was for years the floor. As Jim pointed out last night, if the market does bounce from support at the current level and approach the high again, but the VIX fails to get and stay back below the 20 or even the 18 area, than the VIX will probably be telling us that the move is not trustworthy. This would confirm the same message Jim has been hammering away at on the $NYAD, which remains completely broken down from the top despite the DOW still holding up.


I hope this makes sense to you, whether you agree with the interpretation or not. Whatever the case, the most important thing is that you question and interpret it for yourself and don't just accept whatever I or whoever else has to say.
I'll let you go through the process and do the NDX yourself.

Until next time!

Sunday, June 24, 2007

Market Posture

In my last post on June 3, despite the apparent reasons for caution, I concluded that things were still quite bullish. I am trying to reiterate to myself as well as others that a trend or posture isn't "changed" until it changes. So since the various significant levels and moving averages hadn't yet been broken, a trend trader could only assume that things will continue on as usual. Since then, some of the significant red flags have been raised. The uptrend has not yet been broken in terms of highs and lows, but we have put in an equal high and backed off that level, leaving it as a fortified resistance point and putting the uptrend strongly in question. A lower high and lower low will officially change the trend to downward. Until then, we'll noodle more or less sideways.
As for the moving averages, the 20 MA was broken, reclaimed and again broken. Meanwhile, the 50 MA has provided support on two quick bounces. Friday's close was just below the 50 MA, so I'll call it breached but not definitively broken. Will it hold again or finally crack?
You may also notice on your charts that the SPX is now showing a fresh set of 3 red arrows, the second set that has recently appeared since the big run began with a double bottom reversal in March.
Notice also that the Market Forecast intermediate term line (green) is heading down and has exited the upper reversal zone. Obviously, this is bearish for the intermediate term on this indicator. The Longer term orange line is still above 80 but is rounding over and showing potential for a more meaningful downturn, though 80 remains the official signal line to call it bearish.
Keeping things simple, though, we must remember that price is king and the most obvious signs now will be the strong breaking of the 50 and certainly taking out the recent lows around 1490.
(Click imagine to see it larger)

For the third part of the Investools taught market posture procedure, we look to the VIX. I want to emphasize, particularly to ease Jim's mind, that these other aspects of the Market Posture procedure should be looked at as confirming indicators and in no way should be thought to hold more sway or even equal the power and significance of the index price and posture itself.
With that said, last time I suggested setting an alert to go off if the VIX broke above its resistance at around 14.50. That alarm was sounded and the VIX has since dropped back below and again risen through 14.50. This weekly chart shows it most clearly. The bias looks upward to me.

But even if the market doesn't drop and in turn lift the VIX, I suspect that this slightly higher level will be sustained and perhaps with a wider range from the 17 area down to 12.50 if not 14. Whatever the specific numbers for support and resistance on this volatility index may turn out to be, the message seems clear that rise or fall, the markets will be more volatile for the foreseeable future. For the active trader, this is actually a good thing. For the buy and hold investor, maybe not.
I'm not going to go through the whole Posture thing for the Nasdaq too, but for a bit of comparison, here is a view at some of the major indexes with weekly candles. I always like looking at weekly candles because it simplifies the daily noise into a clearer big picture view.
I've left off the Dow Jones, as it closely resembles the picture of the SPX. I've also used the Nasdaq 100 because the composite shows a discrepancy between the TOS charts and Prophet charts and I think the data is wrong. Besides, the NDX is perhaps a better, more focused look at the powerhouses of tech.
Most noteworthy to me is the succession of weekly bearish engulfing patterns on the SPX after the recent series of bull runs. This speaks strongly for the likelihood of a trend reversal. What these matching bearish engulfing patterns on the weekly chart translate into on the daily is a potential double top pattern.
But the other thing to consider from a bullish perspective in these charts is that the tech indexes have not shown the same strength as the SPX and Dow since the highs in February. The NDX and SOX especially are showing a bit of relative strength compared to the SPX. While the SOX did sell off with the rest of the market on Friday, it broke out to a new 52-week high on Thursday.

Could the semis and tech lead the next leg of the bull market?

Other factors to keep in mind:

Crude oil broke above its recent resistance level. From here, up seems more likely than down. You can check here for a longer term weekly chart. But here's the daily.


I won't pretend to be very knowledgeable about bonds and treasury notes. But at the very least it makes sense to me that if yields go up, the appeal of being in stocks is decreased for long term investors. We've heard a lot about the 10 year yield rising lately. It may find some resistance here in the area below 5.5, but this very long term chart going back to '81 shows what might be a very significant long, LONG term trend break forming.


I know I've said this before, but I hope to get a new and improved watchlist up soon.
For now keep eyes tuned to VSEA. After a wild up and down day on Friday, it closed near the top of the range, breaking the recent downtredning resistance and peaked back above the 50 MA.

LRCX also looks interesting, though not as high scoring.
Tech monster Google(with an impressive F/E score of 3.88!) is out at a new high after testing old resistance as new support. If you're interested in getting in this stock and not missing the boat again, this seems like as good a time as any. Remember, there's not that big a difference between buying 10 shares of a $50 stock and 1 share of a $500 stock.


On the downside, REITS are looking weaker and weaker. Some have clearly begun breaking down, others are just beginning to crack now. I'd like to see some of the first to break down come up to test resistance for a better entry.
Homebuilders have seen renewed selling. Banks look pretty weak too.

Have a great week!