Wednesday, December 5, 2007

ZOLL

Isn't it great when one of the trades you go public with just turns right around and bites you in the as*?
Just to give an eye to ZOLL which I mentioned to the group, anyone with most any combination of moving averages and indicators would avoid this stock as a bullish play, particularly when looking primarily at the last 3 months.
It's really not all that important which set of indicators you use, if any, but the price action tells the story regardless. Short term trend is certainly down. Intermediate to long term, though, has a neutral/bullish picture to it.
MA's certainly pointing down. Not much more to say. And sure, descending triangle even (though not yet triggered, and therefore still only "potential"). So was/is really still just a support line that is still holding. Just as reasonable to play a bounce when it doesn't breakdown as it is to short it when it breaks down.
In any case, here's what the long term looks like with my markings and no indicators. I think you'll understand my thinking on the trade a bit better by seeing my view of it. It was to bounce at support and go to a target of 27. Stop would get me out if it went the wrong way. And so it did, but it still may prove to be a whipsaw. Am I confident in this trade enough to enter again and maybe even again? No. On the intermediate to long term, it really is at best neural and not so bullish. I may have jumped the gun trying to get in early here. I could still work out. The recent candles seem to forecast it stillbeing a good play off these bottoming hammers. But it's probably safer to look at it again once it convincingly gets above 24.50 but better yet 27. Though I like the idea, I've never really played sideways channels, so I should think more on that instead of trading sideways just because the Market seems somewhat neutral.


On the daily, it did seem to be bouncing off support, but the candle sticks were not clean and clear in the support of the bounce. I liked that volume was picking up with the bounce, but somehow I let that overweight what the price action was telling me in the form of a spinning top, a picture of indecision.


One of the things I wrote down twice a the workshop with Dave Johnson was, "Volume is secondary!" I need to repeat that to myself. Another lesson reinforced. Candles beat volume. The other glaring issue is that the downtrending resistance line was breached intraday, but still not closed above.
Simply put, I jumped in earlier, closer to support, so I could get a better risk/reward and tighter stop/bigger position.

Saturday, December 1, 2007

Market Posture for the Holidays. Feel the spirit!

I like going through the market posture on the weekends. Not so much because it's so different from a day or two before, but because you can look at the bigger picture using all complete weekly candles. Looking at this way tends to smooth out the noise of each individual day and somehow makes the process a bit easier and perhaps more objective.
Here is the Market Posture Grid as filled out at Thursday night's meeting.
(Click on image to see it bigger.)


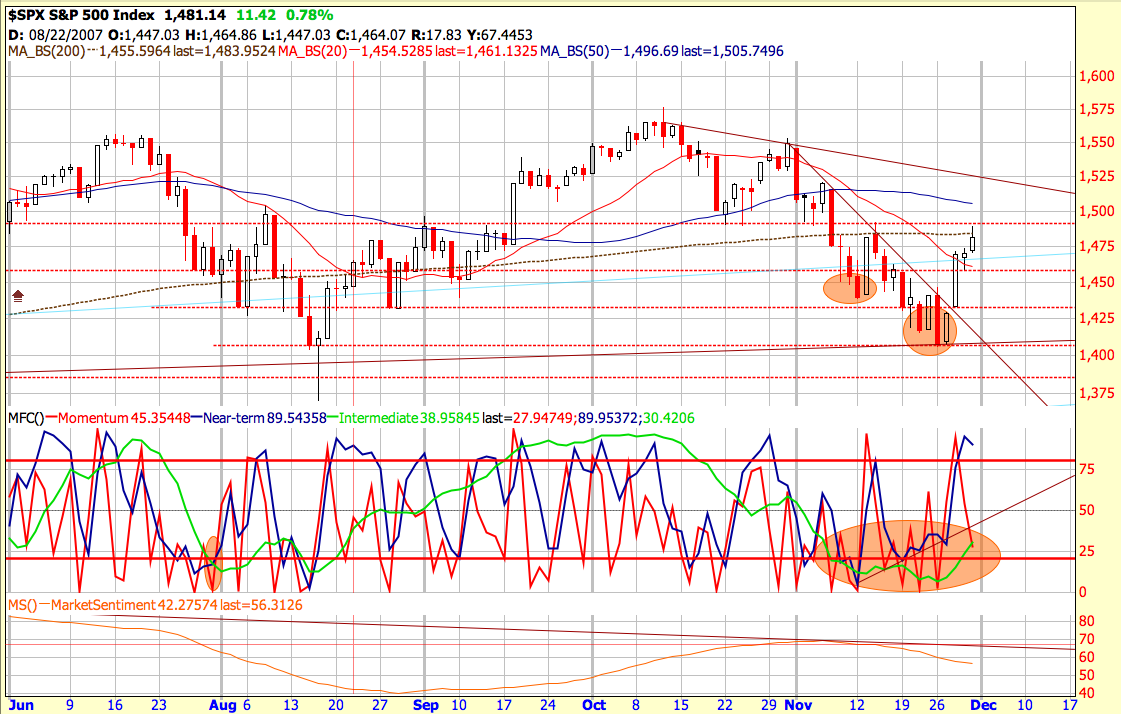
Below is the weekly chart for the SPX. It's hard not to notice that there is a very clearly formed double top formation in process. But like any pattern, it's just a potential pattern until it is complete which is when the support line is broken in this case. It's also very apparent that the higher high is less of an improvement than the previous higher highs. Same with the higher low, and on the daily chart it's more of an equal low. Nevertheless, the intermediate posture on the SPX is still arguably neutral due to no major lower low and still having no major lower high despite the clearly bearish short term trend. What further supports an at least neutral intermediate posture and potentially bullish short term posture is what looks like a possible short term reversal at significant support. This week's candle is clearly bullish(engulfing and then some).
Thursday night we spoke about potential points of resistance to look for in this market rally. Having been a very significant point of support and resistance many times in the last five months, 1490 seems the most obvious level. Interesting to see the rally peaked out just a dollar short of there intra-day on Friday.


The weekly VIX chart also shows some reason to be bullish at least for the time being. The long term trend in the VIX is clearly up and this is a long term bearish indication, but remember that it is the intermediate and to some extent short term that we should be most aware of, as the "long term" shows us what has happened somewhat long into the past. The Intermediate and short term will give us a better idea of what to expect for the immediate future.
On an intermediate time frame, we have a lower high even if just slightly, and a lower low from mid August to late September. Looking a the bearish reversal candles in beginning November, we see that they have been confirmed in the past week's lower close. Furthermore, this week, we got the important piece of the puzzle we were waiting for which was a lower low on the short term VIX, a movement below daily support(and former resistance) just below 24.


For the final component of the Market Posture routine as taught by Investools, the Market forecast is giving us a clear bullish reading on the intermediate term with the green intermediate line having moved upward out of the lower reversal zone.
There is also seen one of the major "signals" that the Market Forecast indicators give which is the "Near Term Divergence." This is where the blue Near Term line puts in a higher low while the SPX itself makes a lower low(opposite for a bearish divergence). As with any signal, it doesn't tell the future or work out every time, but in this case it has worked out at least short term.


It's hard not to feel the fear in the air and even to notice that the SPX is still under the 200 MA even with the rally of the past week. I'll let you do the process with the Nasdaq, but it's interesting to note that doing the three pronged posture in as objective a way as we could, we came up with a Bullish posture for the Nasaq and Neutral for the SPX and only then looked to note that the SPX is below the 200 MA and the Nasdaq is above it. Perhaps it is not earth shattering news, but noteworthy nonetheless.
There are certainly lots of things to be worried about with the economy and even the charts. But there are also potentially positive factors for the market, so who knows?
I won't list the negatives, but as for a few potential positives from one who is FAR from an economics guy, how about oil prices finding a potential top?

How about the weekly bearish engulfing on the Yen at long term resistance? It may be short lived, but it looks like it needs to come back in a bit before moving higher if that's going to happen.

How about the plunge in the US Dollar coming to a halt at least for a while as is shown possible by the bullish engulfing candle on the weekly chart? It's awfully far from the 40 week MA.


This may be grasping at straws, or however that saying goes, but the home builders have just been relentlessly hammered for a long time. Even if the outlook is still far from rosy for them, an end to the plunge is inevitable at some point. We know that all homebuilding in the US will not come to a complete stop and therefore the homebuilders will not go to zero. (All you gloom and doomers, yes the apocalypse is the exception.) Though far from a convincing bounce just yet, we do have a bullish engulfing at an old support level and even bullish divergences on both the MACD lines and the MACD histogram. I can't remember who, but I believe someone from the big name investors out there announced taking a major position in one of the homebuilders this week.


For an even more thorough feel of what "The Market" is doing, I encourage you to build a watchlist of the Sector Spiders. 9 ETFs that as a general snapshot show you the action of the market in 9 clumps of related stock groups. There are many ways to look at the sectors of the market and the "sectors" seem to be defined differently by all, but this seems about as quick and easy as any. Notice that the XLF put in a monster bullish engulfing on the weekly chart with its highest weekly volume to date.

I do realize that my showing only the positives and not the negatives seems an awful lot like being a bullish cheerleader. But really, I just want to focus on the positive a bit, because all we've heard about lately is the negative.

There is, without a doubt, downward pressure on the SPX and tough resistance at 1490 even with this week's rally. I will look to 1430 (support from the inverted head and shoulders in August) for a potential level of support. Just about all of the above will probably be null and void with a decisive break below 1406. With a real break below 1375.......Look out below.

Thursday, October 11, 2007

KGC Flag breakout

Here's a trade I took today.
Gold has been looking great lately and consolidating after some major gains. There is a symmetrical triangle of sorts going on for the last 7 trading days or so. Will it break higher from here? Looked like it was going to today, but then it came back off the high. Check out the chart for gold here.

In any case, the gold stocks have been doing very well as is illustrated by the $XAU (the GDX for an ETF) or the $GOX here. It has broken through some long standing resistance from a big sideways range and even showed new support at last month's resistance level from which to move higher.

(Click image to see it larger.)


I chose to enter KGC today for a stock play as it looks to have broken a bull flag on top of a serious flag pole. Like most stocks in the gold group, it doesn't have a 3.25 F/E score. Honestly, this is more a technical trade than anything, but looking over the fundamentals, I'm still happy with it.

It has good sales and earnings growth in the last year. Very good earnings growth. The Estimates are a bit spotty, but all together acceptable for me. PEG using the 5 year annual growth estimate of 10% is about 3, which is way to high. But using this year's estimate of 47%, it is well under 2. Also, I like that the current P/E of 31 is well below the group P/E of 64. Finally, it has met or beat its estimates every one of the last five quarters and the analysts are mostly favoring the stock.

Long term view shows volume building steadily to a high volume month in September with a big bullish candle. October pushing higher so far and a very old level shows 20 as a likely resistance level and great target.


A slightly closer look at the weekly chart shows some stepping up through bases. Three weeks ago broke through resistance on high volume.


Finally, the daily chart shows a serious rally with the price of gold and a flag developing as gold consolidates too. Today's break may be premature, but it had a nice volume spike, so I took it.
The Flag pole is about $4 high which, tacked on to the upper line of the flag, gives a target of about $19.25. I bought at the end of the day at $15.68 sizing my position for a stop loss level of $14.25. This gives me a risk/reward ratio of 1/2.5. If I let it go to the 20 area shown on the long term chart, it is a bit better.


I will let the stop take me out to the down side. If and when it reaches the $19 area, I will consider whether to take 1/2 at 19.25 or go for all at 20 depending on market conditions and gold. If conditions warrant it, I will let it run and trail a stop.
It is possible for these targets to be reached before earnings come in on Nov. 7, but unlikely. I am prepared to hold over earnings.

GO GOLD!!!!

Monday, September 10, 2007

VIP Buy signal

When we came up with the first five stocks in our new list, VIP was one of them and quickly gave a buy signal according to our group rules. I emailed the group asking how one might view this and place an order to buy. I failed to specify that I meant it in the context of our group rules. Nevertheless, I was a bit disappointed to get only a few responses to the question and none that answered according to all of the work we had done lately on developing a group system dissecting the Investools method. I know that we had yet to "officially" start paper trading the group list, but still the exercise is a good one.

So here is the question from August 31 and roughly what I was looking for:

Q: Would anybody venture to explain why VIP should be a buy today? And to set up how the trade would be sized for 2% risk on a 100K portfolio? How many shares would you buy and what would the order to be placed look like?

A: VIP is in a group ranking in the green on the big chart and one that showed sideways to upward movement. The stock was in a long term uptrend but had recently pulled back from a potentially strong resistance point and even formed a short term downtrend with a lower high and lower low as outlined the in the downward channel on the chart. It gave 3 green arrows, but in the context of a sideways to downward moving stock(with the MA moving downward), it should be considered not buyable. However, on 8/30 it broke out above resistance with double the average volume. This qualifies it as a breakout buy.
(Click on images to see them larger.)

One of the rules we had come up with was to not buy stocks that were more than 10% away from the MA. This would disqualify this stock, but my feeling is that that would prevent a buy of almost any breakout buy. So I think it is appropriate to apply that to breakouts as "no further than 10% above the broken resistance level/expected new support level." This is an example of the type of thing that will show up and need discussing/deciding in the process of trading and refining our system(or any system). (I now look back at the rules and see that it does include specification of 10% above the MA OR BREAKOUT SUPPORT LEVEL. Perhaps it could be worded more clearly, but that does give the go ahead like I just described.) The official group rules can be found in the "Files" section of our Yahoo group.

The resistance line as I've drawn it was 23.41. (Remember that these are areas, not exactly lines. Part art, part science.) With a close on 8/31 of $24.73, it is about 5% above the breakout level/former resistance/assumed new support level and well within our 10% requirement.
Now to figure out how much to buy and place the order.
With a $100,000 account and a risk tolerance of 2%, we are willing to lose $2,000 in this trade. To figure out our position size, we must first figure out where we'll put our stop loss (stop sell) order. We will use 3% below the assumed new support level. To use a simple round number and to give it just a touch more room due to market volatility, I'll use 23 as the new support level. To easily find 3% below support , multiply that level, 23 x .97. That gives us $22.31.
So now we know that we're going to place a buy order at a limit of $24.73(the closing price on the breakout day) with a stop loss order at $22.31. 24.73-22.31 gives us total risk(potential loss per share) in the trade of $2.42.
We then take our acceptable portfolio loss amount of $2000 and divide it by that number representing the risk in the trade. $2,000/2.42=826. We can buy 826 shares and be perfectly positioned for our calculated portfolio risk as tailored to the risk in this particular trade.
But because I would prefer to deal in round lots because it's simpler and matches up nicely with potential hedging with options(buying puts or selling calls) I'll round down to the nearest hundred. So 800 shares it is. This will use $19, 784, under our limit of 25% of our account.

For market open the next day, I place an order to buy 800 shares of VIP at limit of 24.73. Using a "1st trigger sequence" order on Thinkorswim, I line up a second order to be triggered upon filling so that there is instantly a standing "stop sell" order to sell 800 shares of VIP if the stock goes to or below $22.31.


Here is what the order should look like. Notice the GTC(Good 'til cancel) on the stop order. The buy order has a day order, meaning that it would expire if not filled that day. Upon expiration, it would also cancel the stop order.

The next morning, the stock gapped higher at the open and then came down to fill the order at $24.72 at 9:55 AM. The level has held and the position is showing a profit of 1.82%, which is encouraging considering the carnage on Friday in particular.

I hope this has been clear and helpful to those who are still uncomfortable with how to setup a stock trade and place the appropriate orders. Please feel free to chime in in the comments section with any questions or comments.